Understanding Convolutions and Distributions
Interactive Video
•
Mathematics, Science
•
10th Grade - University
•
Practice Problem
•
Hard

Aiden Montgomery
FREE Resource
Read more
10 questions
Show all answers
1.
MULTIPLE CHOICE QUESTION
30 sec • 1 pt
What is the shape of a normal distribution curve?
A straight line
A square
A bell curve
A zigzag pattern
2.
MULTIPLE CHOICE QUESTION
30 sec • 1 pt
What operation is used to combine two distributions in the context of random variables?
Multiplication
Addition
Division
Convolution
3.
MULTIPLE CHOICE QUESTION
30 sec • 1 pt
In the context of rolling dice, what does the diagonal slice in a 3D plot represent?
The sum of probabilities for a specific outcome
The product of probabilities for all outcomes
The average of all probabilities
The difference between two probabilities
4.
MULTIPLE CHOICE QUESTION
30 sec • 1 pt
What is the main difference between probability and probability density?
Probability density is always greater than probability
Probability density is used for discrete variables
Probability density represents the likelihood of a continuous range
Probability density is a fixed value
5.
MULTIPLE CHOICE QUESTION
30 sec • 1 pt
What does the integral of a probability density function represent?
The maximum probability
The average probability
The sum of all possible outcomes
The total probability over a range
6.
MULTIPLE CHOICE QUESTION
30 sec • 1 pt
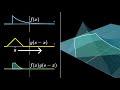
What is the result of convolving two uniform distributions?
A constant distribution
A wedge-shaped distribution
A random distribution
A normal distribution
7.
MULTIPLE CHOICE QUESTION
30 sec • 1 pt
What happens to the shape of a distribution as you repeatedly convolve it?
It flattens out completely
It becomes more jagged
It becomes a uniform distribution
It approaches a normal distribution
Access all questions and much more by creating a free account
Create resources
Host any resource
Get auto-graded reports
Continue with Google

Continue with Email
Continue with Classlink
Continue with Clever
or continue with
Microsoft
%20(1).png)
Apple
Others
Already have an account?
