Understanding the Graph of George's Candy Bars
Interactive Video
•
Mathematics
•
6th - 8th Grade
•
Practice Problem
•
Hard
+4
Standards-aligned

Emma Peterson
FREE Resource
Standards-aligned
Read more
10 questions
Show all answers
1.
MULTIPLE CHOICE QUESTION
30 sec • 1 pt
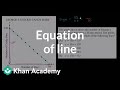
What does the graph represent in the context of George's candy bars?
The price of candy bars over time
The total number of candy bars George had
The number of unsold candy bars over a 10-day period
The number of candy bars sold each day
Tags
CCSS.HSF.BF.A.2
2.
MULTIPLE CHOICE QUESTION
30 sec • 1 pt
What happens to the number of unsold candy bars by day 10?
Half of the candy bars are sold
Candy bars are doubled
No candy bars are sold
All candy bars are sold
Tags
CCSS.8.EE.B.5
3.
MULTIPLE CHOICE QUESTION
30 sec • 1 pt
How is the slope of a line generally defined?
The product of the vertical and horizontal changes
The change in the vertical-axis for a given change in the horizontal-axis
The change in the horizontal-axis for a given change in the vertical-axis
The sum of the vertical and horizontal changes
Tags
CCSS.8.EE.B.5
4.
MULTIPLE CHOICE QUESTION
30 sec • 1 pt
What is the calculated slope of the line representing George's unsold candy bars?
Positive 12
Negative 10
Negative 12
Positive 10
Tags
CCSS.HSF.LE.B.5
5.
MULTIPLE CHOICE QUESTION
30 sec • 1 pt
What does the slope of negative 12 indicate about the candy bars?
Candy bars are sold in batches of 12
Candy bars remain constant
Candy bars are decreasing by 12 each day
Candy bars are increasing by 12 each day
Tags
CCSS.8.EE.B.5
6.
MULTIPLE CHOICE QUESTION
30 sec • 1 pt
Which line correctly represents the points on the graph?
A line with a slope of negative 10
A line with a slope of positive 12
A line with a slope of negative 12
A line with a slope of positive 10
Tags
CCSS.8.EE.B.6
CCSS.8.F.A.3
7.
MULTIPLE CHOICE QUESTION
30 sec • 1 pt
What is the general form of the equation of a line?
y = b - mx
y = mx + b
y = b + mx
y = x + mb
Tags
CCSS.HSF.LE.B.5
Access all questions and much more by creating a free account
Create resources
Host any resource
Get auto-graded reports
Continue with Google

Continue with Email
Continue with Classlink
Continue with Clever
or continue with
Microsoft
%20(1).png)
Apple
Others
Already have an account?
