Graphing Quadratic Functions Concepts
Interactive Video
•
Mathematics
•
6th - 8th Grade
•
Practice Problem
•
Medium
Standards-aligned

Ethan Morris
Used 2+ times
FREE Resource
Standards-aligned
Read more
10 questions
Show all answers
1.
MULTIPLE CHOICE QUESTION
30 sec • 1 pt
What is the first step in graphing the equation y = x^2 - x - 6?
Creating a table of values
Plotting random points
Calculating the slope
Drawing the axes
Tags
CCSS.HSF.IF.A.2
2.
MULTIPLE CHOICE QUESTION
30 sec • 1 pt
If x is -3, what is the value of y in the equation y = x^2 - x - 6?
9
6
3
0
Tags
CCSS.HSF.IF.A.2
3.
MULTIPLE CHOICE QUESTION
30 sec • 1 pt
What is the y-value when x is -1 in the equation y = x^2 - x - 6?
-4
0
2
-6
Tags
CCSS.HSF.IF.A.2
4.
MULTIPLE CHOICE QUESTION
30 sec • 1 pt
For x = 0, what is the corresponding y-value in the equation y = x^2 - x - 6?
0
-4
-6
6
Tags
CCSS.HSF.IF.A.2
5.
MULTIPLE CHOICE QUESTION
30 sec • 1 pt
What is the y-value when x is 2 in the equation y = x^2 - x - 6?
-4
-6
0
2
Tags
CCSS.HSF.IF.A.2
6.
MULTIPLE CHOICE QUESTION
30 sec • 1 pt
What is the y-value when x is 3 in the equation y = x^2 - x - 6?
9
3
0
6
Tags
CCSS.HSF-IF.C.7A
7.
MULTIPLE CHOICE QUESTION
30 sec • 1 pt
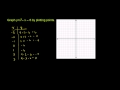
What shape is formed when the points are plotted on the graph?
Rectangle
Parabola
Line
Circle
Access all questions and much more by creating a free account
Create resources
Host any resource
Get auto-graded reports
Continue with Google

Continue with Email
Continue with Classlink
Continue with Clever
or continue with
Microsoft
%20(1).png)
Apple
Others
Already have an account?
Similar Resources on Wayground
Popular Resources on Wayground

15 questions
Fractions on a Number Line
Quiz
•
3rd Grade
20 questions
Equivalent Fractions
Quiz
•
3rd Grade
25 questions
Multiplication Facts
Quiz
•
5th Grade
29 questions
Alg. 1 Section 5.1 Coordinate Plane
Quiz
•
9th Grade
22 questions
fractions
Quiz
•
3rd Grade
11 questions
FOREST Effective communication
Lesson
•
KG
20 questions
Main Idea and Details
Quiz
•
5th Grade
20 questions
Context Clues
Quiz
•
6th Grade
Discover more resources for Mathematics
36 questions
6th Grade Math STAAR Review
Quiz
•
6th Grade
14 questions
Volume of rectangular prisms
Quiz
•
7th Grade
14 questions
finding slope from a graph
Quiz
•
8th Grade
20 questions
Graphing Inequalities on a Number Line
Quiz
•
6th - 9th Grade
23 questions
Solve and Graph Inequalities
Quiz
•
6th Grade
15 questions
Distributive Property & Review
Quiz
•
6th Grade
10 questions
Mean, Median, Mode, and Range
Quiz
•
7th Grade
17 questions
Area of a parallelogram
Quiz
•
6th Grade