Understanding Implied Volatility and Expected Range of Stocks
Interactive Video
•
Mathematics, Business
•
10th - 12th Grade
•
Practice Problem
•
Easy

Aiden Montgomery
Used 1+ times
FREE Resource
Read more
10 questions
Show all answers
1.
MULTIPLE CHOICE QUESTION
30 sec • 1 pt
What happens to option prices when implied volatility increases?
Option prices remain the same
Option prices become unpredictable
Option prices decrease
Option prices increase
2.
MULTIPLE CHOICE QUESTION
30 sec • 1 pt
If a stock is trading at $100 with an implied volatility of 20%, what is the expected price of a 110 call option?
$1.50
$2.73
$1.00
$3.00
3.
MULTIPLE CHOICE QUESTION
30 sec • 1 pt
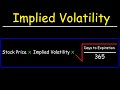
Which formula is used to calculate the expected range of a stock with a 68% confidence level?
Stock price divided by implied volatility
Implied volatility times square root of stock price
Stock price times implied volatility times square root of days to expiration divided by 365
Stock price times implied volatility
4.
MULTIPLE CHOICE QUESTION
30 sec • 1 pt
In the example with a stock price of $200 and 30% implied volatility, what is the expected range of the stock price within one year?
$140 to $260
$100 to $300
$180 to $220
$150 to $250
5.
MULTIPLE CHOICE QUESTION
30 sec • 1 pt
For a stock with a 30-day option and 42% implied volatility, what is the expected range of the stock price?
$120.00 to $180.00
$130.00 to $170.00
$131.94 to $168.06
$140.00 to $160.00
6.
MULTIPLE CHOICE QUESTION
30 sec • 1 pt
What is the probability that a stock's price will fall within one standard deviation of the mean in a standard normal distribution?
99.7%
50%
68%
95%
7.
MULTIPLE CHOICE QUESTION
30 sec • 1 pt
How does the confidence level change when calculating the expected range within two standard deviations?
It increases to 95%
It remains at 68%
It increases to 99.7%
It decreases to 50%
Access all questions and much more by creating a free account
Create resources
Host any resource
Get auto-graded reports
Continue with Google

Continue with Email
Continue with Classlink
Continue with Clever
or continue with
Microsoft
%20(1).png)
Apple
Others
Already have an account?
