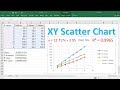
Creating and Customizing XY Scatter Charts
Interactive Video
•
Mathematics, Computers, Education, Instructional Technology
•
7th - 12th Grade
•
Practice Problem
•
Hard
+2
Standards-aligned

Ethan Morris
FREE Resource
Standards-aligned
Read more
10 questions
Show all answers
1.
MULTIPLE CHOICE QUESTION
30 sec • 1 pt
What is the first step in creating an XY scatter chart in Excel?
Customize the chart style
Calculate the slope and y-intercept
Add a trendline to the chart
Select the data columns and insert the chart
2.
MULTIPLE CHOICE QUESTION
30 sec • 1 pt
Which chart element allows you to label the axes in an XY scatter chart?
Legend
Grid lines
Axis titles
Data labels
Tags
CCSS.8.SP.A.2
3.
MULTIPLE CHOICE QUESTION
30 sec • 1 pt
How can you display the equation and R-value on an XY scatter chart?
By changing the chart color
By adding a trendline and choosing display options
By selecting the chart style
By resizing the chart
Tags
CCSS.8.SP.A.3
4.
MULTIPLE CHOICE QUESTION
30 sec • 1 pt
Which Excel function is used to calculate the slope of a line in an XY scatter chart?
SLOPE
TREND
CORREL
INTERCEPT
5.
MULTIPLE CHOICE QUESTION
30 sec • 1 pt
What is the purpose of using the CORREL function in Excel?
To change the chart style
To calculate the slope of a line
To find the y-intercept
To determine the correlation between x and y values
Tags
CCSS.HSS.ID.C.8
6.
MULTIPLE CHOICE QUESTION
30 sec • 1 pt
What is the significance of the R-value in an XY scatter chart?
It determines the chart style
It is used to change the chart color
It indicates the correlation between x and y values
It represents the slope of the line
Tags
CCSS.8.EE.B.5
7.
MULTIPLE CHOICE QUESTION
30 sec • 1 pt
How can you ensure more accurate calculations of slope and y-intercept in Excel?
By using Excel functions like SLOPE and INTERCEPT
By using rounded values
By adding more grid lines
By changing the chart style
Access all questions and much more by creating a free account
Create resources
Host any resource
Get auto-graded reports
Continue with Google

Continue with Email
Continue with Classlink
Continue with Clever
or continue with
Microsoft
%20(1).png)
Apple
Others
Already have an account?
