Mastering Enzyme Kinetics Through the Lineweaver-Burk Plot
Interactive Video
•
Biology, Chemistry, Mathematics
•
11th - 12th Grade
•
Practice Problem
•
Hard

Patricia Brown
FREE Resource
Read more
10 questions
Show all answers
1.
MULTIPLE CHOICE QUESTION
30 sec • 1 pt
What is the main issue with estimating Vmax using the traditional enzyme kinetics plot?
The plot is too complex to interpret.
The plateau region is not perfectly horizontal.
The plot does not show any plateau.
The plot is not related to substrate concentration.
2.
MULTIPLE CHOICE QUESTION
30 sec • 1 pt
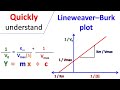
How is the Lineweaver-Burk plot derived from the Michaelis-Menten equation?
By multiplying both sides by Vmax.
By taking the inverse of both sides.
By adding Km to both sides.
By subtracting S from both sides.
3.
MULTIPLE CHOICE QUESTION
30 sec • 1 pt
In the Lineweaver-Burk plot, what does the y-intercept represent?
1/Vmax
Km/Vmax
1/Km
Vmax/Km
4.
MULTIPLE CHOICE QUESTION
30 sec • 1 pt
What is the advantage of the Lineweaver-Burk plot being a straight line?
It allows for more data points to be plotted.
It eliminates the need for substrate concentration.
It simplifies the estimation of Vmax and Km.
It makes the graph more colorful.
5.
MULTIPLE CHOICE QUESTION
30 sec • 1 pt
Why is the Lineweaver-Burk plot useful for understanding enzyme inhibition?
It shows the exact reaction time.
It clearly indicates changes in Km and Vmax.
It eliminates the need for enzyme concentration.
It provides a 3D view of the reaction.
6.
MULTIPLE CHOICE QUESTION
30 sec • 1 pt
What is a limitation of the Lineweaver-Burk plot?
It is only applicable to non-enzymatic reactions.
It requires a lot of substrate.
It uses inverse values which can cluster data points.
It cannot be plotted on graph paper.
7.
MULTIPLE CHOICE QUESTION
30 sec • 1 pt
What happens to the value of 1/S when the substrate concentration is very high?
It remains constant.
It becomes negative.
It becomes very small.
It becomes very large.
Access all questions and much more by creating a free account
Create resources
Host any resource
Get auto-graded reports
Continue with Google

Continue with Email
Continue with Classlink
Continue with Clever
or continue with
Microsoft
%20(1).png)
Apple
Others
Already have an account?
