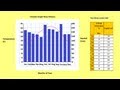
Constructing Climate Graphs: Analyzing New Orleans Weather Patterns
Interactive Video
•
Mathematics, Science, Geography
•
6th - 7th Grade
•
Practice Problem
•
Hard

Patricia Brown
FREE Resource
Read more
8 questions
Show all answers
1.
MULTIPLE CHOICE QUESTION
30 sec • 1 pt
What are the two main components of a climate graph?
A yellow bar graph and a green line graph
A blue bar graph and a red line graph
A green bar graph and a yellow line graph
A red bar graph and a blue line graph
2.
MULTIPLE CHOICE QUESTION
30 sec • 1 pt
What type of data is needed to construct a climate graph?
Wind speed and humidity data
Sunshine hours and cloud cover data
Temperature and rainfall data
Pressure and altitude data
3.
MULTIPLE CHOICE QUESTION
30 sec • 1 pt
How should the X-axis be divided when constructing a climate graph?
Into 12 sections for each month
Into 4 sections for each season
Into 6 sections for every two months
Into 2 sections for summer and winter
4.
MULTIPLE CHOICE QUESTION
30 sec • 1 pt
What is the highest temperature value used on the Y-axis for New Orleans?
30 degrees Celsius
33 degrees Celsius
36 degrees Celsius
40 degrees Celsius
5.
MULTIPLE CHOICE QUESTION
30 sec • 1 pt
What color is used to represent rainfall in a climate graph?
Blue
Green
Red
Yellow
6.
MULTIPLE CHOICE QUESTION
30 sec • 1 pt
What should be done after plotting the temperature data on the graph?
Draw a line connecting the dots
Add more dots
Erase the dots
Change the color of the dots
7.
MULTIPLE CHOICE QUESTION
30 sec • 1 pt
What pattern is observed in New Orleans' climate graph during summer?
High rainfall and high temperatures
High rainfall and low temperatures
Low rainfall and high temperatures
Low rainfall and low temperatures
Access all questions and much more by creating a free account
Create resources
Host any resource
Get auto-graded reports
Continue with Google

Continue with Email
Continue with Classlink
Continue with Clever
or continue with
Microsoft
%20(1).png)
Apple
Others
Already have an account?
