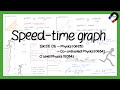
Analyzing Speed-Time Graphs and Their Implications in Motion
Interactive Video
•
Physics, Mathematics, Science
•
9th - 10th Grade
•
Practice Problem
•
Hard

Patricia Brown
FREE Resource
Read more
10 questions
Show all answers
1.
MULTIPLE CHOICE QUESTION
30 sec • 1 pt
What does the gradient of a speed-time graph represent?
Distance moved
Acceleration
Time taken
Speed
2.
MULTIPLE CHOICE QUESTION
30 sec • 1 pt
What does a horizontal line on a speed-time graph indicate?
Constant speed
Decreasing speed
Variable speed
Increasing speed
3.
MULTIPLE CHOICE QUESTION
30 sec • 1 pt
What does a straight line with a positive gradient on a speed-time graph indicate?
Constant speed
Increasing speed with constant acceleration
Decreasing speed
Increasing speed with decreasing acceleration
4.
MULTIPLE CHOICE QUESTION
30 sec • 1 pt
How do you calculate acceleration from a speed-time graph?
By dividing the change in speed by the change in time
By multiplying speed by time
By adding speed and time
By finding the area under the graph
5.
MULTIPLE CHOICE QUESTION
30 sec • 1 pt
Between which points is the acceleration constant in the given example?
B to C
C to D
A to B
D to E
6.
MULTIPLE CHOICE QUESTION
30 sec • 1 pt
What is the deceleration between points E to F in the example?
4 meters per second squared
6 meters per second squared
10 meters per second squared
8 meters per second squared
7.
MULTIPLE CHOICE QUESTION
30 sec • 1 pt
How is the total distance moved calculated from a speed-time graph?
By finding the gradient of the graph
By calculating the area under the graph
By adding all speed values
By multiplying speed by time
Access all questions and much more by creating a free account
Create resources
Host any resource
Get auto-graded reports
Continue with Google

Continue with Email
Continue with Classlink
Continue with Clever
or continue with
Microsoft
%20(1).png)
Apple
Others
Already have an account?
Popular Resources on Wayground

8 questions
Spartan Way - Classroom Responsible
Quiz
•
9th - 12th Grade
15 questions
Fractions on a Number Line
Quiz
•
3rd Grade
14 questions
Boundaries & Healthy Relationships
Lesson
•
6th - 8th Grade
20 questions
Equivalent Fractions
Quiz
•
3rd Grade
3 questions
Integrity and Your Health
Lesson
•
6th - 8th Grade
25 questions
Multiplication Facts
Quiz
•
5th Grade
9 questions
FOREST Perception
Lesson
•
KG
20 questions
Main Idea and Details
Quiz
•
5th Grade
Discover more resources for Physics
10 questions
Exit Check 4.5 - Impulse
Quiz
•
9th Grade
20 questions
Simple Machines and Mechanical Advantage Quiz
Quiz
•
9th Grade
20 questions
Electricity/Magnets
Quiz
•
9th Grade
20 questions
Light Vs. Sound Waves
Quiz
•
9th - 12th Grade
14 questions
Bill Nye Waves
Interactive video
•
9th - 12th Grade
37 questions
CIA #3 Study Guide: ACPS
Quiz
•
10th Grade
20 questions
Waves
Quiz
•
9th - 12th Grade
10 questions
Exploring the Properties of Waves
Interactive video
•
9th - 12th Grade