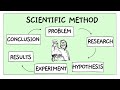
Mastering The Scientific Method Through Engaging Scenarios
Interactive Video
•
Science, Biology, Physics
•
6th - 7th Grade
•
Practice Problem
•
Medium

Patricia Brown
Used 1+ times
FREE Resource
Read more
9 questions
Show all answers
1.
MULTIPLE CHOICE QUESTION
30 sec • 1 pt
What is the first step in the scientific method?
Analyzing results
Conducting an experiment
Identifying the problem
Forming a hypothesis
2.
MULTIPLE CHOICE QUESTION
30 sec • 1 pt
Which of the following is a method for conducting research?
Ignoring the problem
Reading scientific books
Conducting an experiment
Guessing
3.
MULTIPLE CHOICE QUESTION
30 sec • 1 pt
What is a hypothesis?
A random guess
An educated guess based on research
A variable in an experiment
A proven fact
4.
MULTIPLE CHOICE QUESTION
30 sec • 1 pt
What is the role of the independent variable in an experiment?
It is the variable that remains constant
It is the variable that is changed
It is the variable that is ignored
It is the variable that is measured
5.
MULTIPLE CHOICE QUESTION
30 sec • 1 pt
Where is the dependent variable typically graphed?
On the x-axis
On the z-axis
On the y-axis
On the w-axis
6.
MULTIPLE CHOICE QUESTION
30 sec • 1 pt
Why is a large sample size important in an experiment?
To increase the complexity
To ensure accuracy and reliability
To make the experiment more expensive
To reduce the time needed
7.
MULTIPLE CHOICE QUESTION
30 sec • 1 pt
What type of data is recorded in charts and graphs?
Hypothetical data
Qualitative data
Quantitative data
Descriptive data
Access all questions and much more by creating a free account
Create resources
Host any resource
Get auto-graded reports
Continue with Google

Continue with Email
Continue with Microsoft
or continue with

%20(1).png)
Apple
Others
Already have an account?
