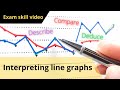
Mastering Graph Interpretation in Mathematics and Science
Interactive Video
•
Mathematics, Science, Biology
•
9th - 10th Grade
•
Practice Problem
•
Hard

Patricia Brown
FREE Resource
Read more
10 questions
Show all answers
1.
MULTIPLE CHOICE QUESTION
30 sec • 1 pt
What are the three skills you will learn in this video?
Drawing graphs, solving equations, and making predictions
Describing trends, comparing equations, and making calculations
Describing graphs, comparing data sets, and making deductions
Identifying trends, calculating averages, and making assumptions
2.
MULTIPLE CHOICE QUESTION
30 sec • 1 pt
When describing a line graph, what should you identify?
The color of the lines
The labels on the y-axis
The trends and significant points like maxima and minima
The number of lines
3.
MULTIPLE CHOICE QUESTION
30 sec • 1 pt
What does the slope of a line in a graph indicate?
The color of the graph
The number of data points
The type of graph
The rate of change of the variable
4.
MULTIPLE CHOICE QUESTION
30 sec • 1 pt
How did Ben's blood glucose level compare to Alan's at the start?
It fluctuated
It was higher
It was lower
It was the same
5.
MULTIPLE CHOICE QUESTION
30 sec • 1 pt
What is a key factor to compare when analyzing different data sets in a graph?
The color of the lines
The starting points and slopes of the lines
The number of lines
The labels on the x-axis
6.
MULTIPLE CHOICE QUESTION
30 sec • 1 pt
What conclusion can be drawn about Ben's blood glucose level at the end?
It returned to the original level
It fluctuated randomly
It was lower than Alan's
It remained higher and did not return to the original level
7.
MULTIPLE CHOICE QUESTION
30 sec • 1 pt
What type of diabetes does Ben have based on the graph analysis?
Type 2 diabetes
Gestational diabetes
Type 1 diabetes
No diabetes
Access all questions and much more by creating a free account
Create resources
Host any resource
Get auto-graded reports
Continue with Google

Continue with Email
Continue with Classlink
Continue with Clever
or continue with
Microsoft
%20(1).png)
Apple
Others
Already have an account?
Similar Resources on Wayground
Popular Resources on Wayground

15 questions
Fractions on a Number Line
Quiz
•
3rd Grade
10 questions
Probability Practice
Quiz
•
4th Grade
15 questions
Probability on Number LIne
Quiz
•
4th Grade
20 questions
Equivalent Fractions
Quiz
•
3rd Grade
25 questions
Multiplication Facts
Quiz
•
5th Grade
22 questions
fractions
Quiz
•
3rd Grade
6 questions
Appropriate Chromebook Usage
Lesson
•
7th Grade
10 questions
Greek Bases tele and phon
Quiz
•
6th - 8th Grade
Discover more resources for Mathematics
23 questions
TSI Math Vocabulary
Quiz
•
10th - 12th Grade
15 questions
Graphing Inequalities
Quiz
•
7th - 9th Grade
20 questions
Graphing Inequalities on a Number Line
Quiz
•
6th - 9th Grade
15 questions
Combine Like Terms and Distributive Property
Quiz
•
8th - 9th Grade
10 questions
Plotting Points on a Coordinate Plane: Quadrant 1 Essentials
Interactive video
•
6th - 10th Grade
20 questions
Perfect Squares and Square Roots
Quiz
•
9th Grade
10 questions
Exploring Abiotic and Biotic Factors in Ecosystems
Interactive video
•
6th - 10th Grade
20 questions
Function or Not a Function
Quiz
•
8th - 9th Grade