Analyzing Sample Proportions Through Histogram Interpretation
Interactive Video
•
Mathematics, Science, Social Studies
•
9th - 10th Grade
•
Practice Problem
•
Hard

Patricia Brown
FREE Resource
Read more
10 questions
Show all answers
1.
MULTIPLE CHOICE QUESTION
30 sec • 1 pt
What was the proportion of freshmen in Tia's sample?
0.2 or 20%
0.3 or 30%
0.4 or 40%
0.5 or 50%
2.
MULTIPLE CHOICE QUESTION
30 sec • 1 pt
Why did Seth and Tia decide to collect more samples?
To confirm Tia's results
To increase the sample size to 100
To get a better picture of the population
To prove Seth's results were wrong
3.
MULTIPLE CHOICE QUESTION
30 sec • 1 pt
How many additional samples did Seth and Tia collect?
100
50
20
10
4.
MULTIPLE CHOICE QUESTION
30 sec • 1 pt
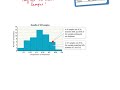
What does the histogram represent in the context of the study?
The total number of students surveyed
The average age of students
The number of freshmen in Tia's sample
The distribution of sample proportions
5.
MULTIPLE CHOICE QUESTION
30 sec • 1 pt
In how many samples did the proportion of freshmen fall between 30% and 35%?
6
10
14
20
6.
MULTIPLE CHOICE QUESTION
30 sec • 1 pt
What range did most of the sample proportions fall into?
0.05 to 0.15
0.3 to 0.5
0.2 to 0.4
0.1 to 0.35
7.
MULTIPLE CHOICE QUESTION
30 sec • 1 pt
Which sample result was outside the range of most samples?
Neither was outside the range
Tia's 40%
Seth's 20%
Both were within the range
Access all questions and much more by creating a free account
Create resources
Host any resource
Get auto-graded reports
Continue with Google

Continue with Email
Continue with Classlink
Continue with Clever
or continue with
Microsoft
%20(1).png)
Apple
Others
Already have an account?
Popular Resources on Wayground

15 questions
Fractions on a Number Line
Quiz
•
3rd Grade
20 questions
Equivalent Fractions
Quiz
•
3rd Grade
25 questions
Multiplication Facts
Quiz
•
5th Grade
54 questions
Analyzing Line Graphs & Tables
Quiz
•
4th Grade
22 questions
fractions
Quiz
•
3rd Grade
20 questions
Main Idea and Details
Quiz
•
5th Grade
20 questions
Context Clues
Quiz
•
6th Grade
15 questions
Equivalent Fractions
Quiz
•
4th Grade
Discover more resources for Mathematics
20 questions
Graphing Inequalities on a Number Line
Quiz
•
6th - 9th Grade
18 questions
SAT Prep: Ratios, Proportions, & Percents
Quiz
•
9th - 10th Grade
12 questions
Exponential Growth and Decay
Quiz
•
9th Grade
12 questions
Parallel Lines Cut by a Transversal
Quiz
•
10th Grade
12 questions
Add and Subtract Polynomials
Quiz
•
9th - 12th Grade
15 questions
Combine Like Terms and Distributive Property
Quiz
•
8th - 9th Grade
20 questions
Function or Not a Function
Quiz
•
8th - 9th Grade
10 questions
Elijah McCoy: Innovations and Impact in Black History
Interactive video
•
6th - 10th Grade