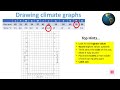
Mastering Climate Graphs and Key Concepts in Meteorology
Interactive Video
•
Mathematics, Science, Geography
•
6th - 8th Grade
•
Practice Problem
•
Hard

Patricia Brown
FREE Resource
Read more
10 questions
Show all answers
1.
MULTIPLE CHOICE QUESTION
30 sec • 1 pt
What is the primary purpose of this presentation?
To teach how to draw climate graphs
To provide a weather forecast
To explain the history of climate change
To discuss the impact of global warming
2.
MULTIPLE CHOICE QUESTION
30 sec • 1 pt
What does the term 'temperature' refer to in the context of climate graphs?
The amount of rainfall in a region
The speed of wind in a particular area
The measure of how hot or cold the atmosphere is
The level of humidity in the air
3.
MULTIPLE CHOICE QUESTION
30 sec • 1 pt
How is 'climate' defined in the presentation?
The amount of sunlight a region receives
The average expected weather conditions of an atmosphere in a place
The frequency of natural disasters in an area
The daily weather conditions of a place
4.
MULTIPLE CHOICE QUESTION
30 sec • 1 pt
What should you do before starting to label the axis on a climate graph?
Double check that you can easily plot the data
Decide on the title of the graph
Ensure you have a ruler
Choose the colors for your graph
5.
MULTIPLE CHOICE QUESTION
30 sec • 1 pt
What is the highest rainfall value mentioned in the data?
80mm in February
76mm in November
50mm in December
60mm in January
6.
MULTIPLE CHOICE QUESTION
30 sec • 1 pt
What tool is recommended for drawing the depth bars in the rainfall chart?
A marker
A paintbrush
A pen
A pencil and a ruler
7.
MULTIPLE CHOICE QUESTION
30 sec • 1 pt
What should you ensure when plotting the first part of the rainfall graph?
That the bars are different colors
That the bars are labeled with months
That the bars are evenly spaced
That you are using the correct rainfall data and axis
Access all questions and much more by creating a free account
Create resources
Host any resource
Get auto-graded reports
Continue with Google

Continue with Email
Continue with Microsoft
or continue with

%20(1).png)
Apple
Others
Already have an account?
