States of Matter and Phase Changes Explained Through Graphs
Interactive Video
•
Physics, Chemistry, Science
•
6th - 8th Grade
•
Practice Problem
•
Hard

Patricia Brown
FREE Resource
Read more
8 questions
Show all answers
1.
MULTIPLE CHOICE QUESTION
30 sec • 1 pt
What are the three common states of matter?
Solid, Liquid, and Gas
Solid, Gas, and Plasma
Solid, Liquid, and Plasma
Liquid, Gas, and Plasma
2.
MULTIPLE CHOICE QUESTION
30 sec • 1 pt
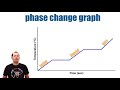
What does the horizontal axis represent on a phase change graph?
Volume
Pressure
Temperature
Time
3.
MULTIPLE CHOICE QUESTION
30 sec • 1 pt
What happens to the kinetic energy of a substance as heat is added in the slanted portions of the graph?
It decreases
It fluctuates
It increases
It remains constant
4.
MULTIPLE CHOICE QUESTION
30 sec • 1 pt
During which phase change does the temperature remain constant?
When a solid becomes a liquid
When a liquid becomes a gas
When a gas becomes a liquid
Both a and c
5.
MULTIPLE CHOICE QUESTION
30 sec • 1 pt
What is affected by the added energy during a phase change?
The temperature of the substance
The molecular bonds of the substance
The volume of the substance
The color of the substance
6.
MULTIPLE CHOICE QUESTION
30 sec • 1 pt
What happens to molecular bonds during melting?
They form new bonds
They are broken
They remain unchanged
They become stronger
7.
MULTIPLE CHOICE QUESTION
30 sec • 1 pt
What does the horizontal portion of the graph represent?
A change in temperature
A change in volume
A change in state of matter
A change in pressure
Access all questions and much more by creating a free account
Create resources
Host any resource
Get auto-graded reports
Continue with Google

Continue with Email
Continue with Classlink
Continue with Clever
or continue with
Microsoft
%20(1).png)
Apple
Others
Already have an account?
Popular Resources on Wayground

15 questions
Fractions on a Number Line
Quiz
•
3rd Grade
20 questions
Equivalent Fractions
Quiz
•
3rd Grade
25 questions
Multiplication Facts
Quiz
•
5th Grade
29 questions
Alg. 1 Section 5.1 Coordinate Plane
Quiz
•
9th Grade
22 questions
fractions
Quiz
•
3rd Grade
11 questions
FOREST Effective communication
Lesson
•
KG
20 questions
Main Idea and Details
Quiz
•
5th Grade
20 questions
Context Clues
Quiz
•
6th Grade
Discover more resources for Physics
26 questions
Electricity and Magnetism Review
Quiz
•
8th Grade
17 questions
Newtons Laws
Quiz
•
8th Grade
21 questions
EM Spectrum
Quiz
•
6th - 9th Grade
16 questions
EM Spectrum and Waves
Quiz
•
7th - 8th Grade
14 questions
Graphs of Motion, Velocity & Acceleration
Quiz
•
8th - 9th Grade
21 questions
PE & KE Practice
Quiz
•
8th - 11th Grade
26 questions
Net Force
Quiz
•
6th Grade
31 questions
Energy & Waves Test Review 6th Grade Texas
Quiz
•
6th Grade