Phase Change Diagrams: Analyzing States of Matter and Energy Transformations
Interactive Video
•
Physics, Chemistry, Science
•
6th - 8th Grade
•
Practice Problem
•
Hard

Patricia Brown
FREE Resource
Read more
10 questions
Show all answers
1.
MULTIPLE CHOICE QUESTION
30 sec • 1 pt
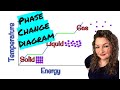
What does the X-axis represent in the phase change diagram?
Temperature
Energy
Volume
Pressure
2.
MULTIPLE CHOICE QUESTION
30 sec • 1 pt
Which state of matter is represented by the lowest blue line segment?
Gas
Liquid
Plasma
Solid
3.
MULTIPLE CHOICE QUESTION
30 sec • 1 pt
What happens to particles in the liquid state compared to the solid state?
They are closer together
They are further apart and slide past each other
They form a rigid structure
They are stationary
4.
MULTIPLE CHOICE QUESTION
30 sec • 1 pt
What do the green line segments on the graph represent?
Temperature changes
Phase changes
States of matter
Energy levels
5.
MULTIPLE CHOICE QUESTION
30 sec • 1 pt
What phase change occurs when a solid turns into a liquid?
Freezing
Condensation
Melting
Sublimation
6.
MULTIPLE CHOICE QUESTION
30 sec • 1 pt
Which line segments indicate increasing kinetic energy?
A and B
C and D
B and D
A, C, and E
7.
MULTIPLE CHOICE QUESTION
30 sec • 1 pt
During which phase change does kinetic energy remain constant?
Vaporization
Condensation
Melting
All of the above
Access all questions and much more by creating a free account
Create resources
Host any resource
Get auto-graded reports
Continue with Google

Continue with Email
Continue with Classlink
Continue with Clever
or continue with
Microsoft
%20(1).png)
Apple
Others
Already have an account?
