Mastering Cooling Curves: Temperature Changes and Phase Transitions
Interactive Video
•
Physics, Chemistry, Science
•
9th - 10th Grade
•
Practice Problem
•
Hard

Patricia Brown
FREE Resource
Read more
8 questions
Show all answers
1.
MULTIPLE CHOICE QUESTION
30 sec • 1 pt
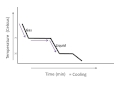
What does a cooling curve graph represent?
Pressure versus time
Temperature versus time
Volume versus time
Density versus time
2.
MULTIPLE CHOICE QUESTION
30 sec • 1 pt
What happens to the temperature of a gas as it cools down in a cooling curve?
It increases
It fluctuates
It remains constant
It decreases
3.
MULTIPLE CHOICE QUESTION
30 sec • 1 pt
What does the first plateau on a cooling curve indicate?
The liquid is changing into a gas
The gas is heating up
The gas is changing into a liquid
The solid is melting
4.
MULTIPLE CHOICE QUESTION
30 sec • 1 pt
How can you identify the condensation point on a cooling curve?
By drawing a horizontal line to the y-axis
By finding the lowest point on the graph
By drawing a vertical line to the x-axis
By finding the highest point on the graph
5.
MULTIPLE CHOICE QUESTION
30 sec • 1 pt
At what temperature does the condensation point occur in the given example?
20 degrees Celsius
50 degrees Celsius
75 degrees Celsius
100 degrees Celsius
6.
MULTIPLE CHOICE QUESTION
30 sec • 1 pt
What is the term used for the phase change from liquid to solid?
Condensation
Evaporation
Freezing
Melting
7.
MULTIPLE CHOICE QUESTION
30 sec • 1 pt
How can you determine the freezing point on a cooling curve?
By drawing a vertical line to the y-axis
By drawing a horizontal line to the x-axis
By finding the highest point on the graph
By finding the midpoint of the graph
Access all questions and much more by creating a free account
Create resources
Host any resource
Get auto-graded reports
Continue with Google

Continue with Email
Continue with Classlink
Continue with Clever
or continue with
Microsoft
%20(1).png)
Apple
Others
Already have an account?
