Graphical Analysis of Motion: Understanding Position Velocity and Acceleration
Interactive Video
•
Physics, Mathematics, Science
•
9th - 12th Grade
•
Practice Problem
•
Easy

Patricia Brown
Used 1+ times
FREE Resource
Read more
10 questions
Show all answers
1.
MULTIPLE CHOICE QUESTION
30 sec • 1 pt
What is one of the best ways to perform quantitative analysis according to Professor Dave?
Using complex equations
Making graphs
Reading textbooks
Conducting experiments
2.
MULTIPLE CHOICE QUESTION
30 sec • 1 pt
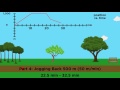
In the example of walking on a path, what is the total distance covered before resting on the bench?
1,000 meters
2,000 meters
1,500 meters
500 meters
3.
MULTIPLE CHOICE QUESTION
30 sec • 1 pt
How is the velocity represented on the graph when the person is at rest?
As a diagonal line
As a vertical line
As a horizontal line at zero
As a steep line
4.
MULTIPLE CHOICE QUESTION
30 sec • 1 pt
What does a negative velocity indicate in the context of the velocity vs. time graph?
Standing still
Moving in the negative direction
Increasing speed
Moving in the positive direction
5.
MULTIPLE CHOICE QUESTION
30 sec • 1 pt
When does acceleration become non-zero according to the tutorial?
When position is constant
When velocity is changing
When velocity is constant
When time is constant
6.
MULTIPLE CHOICE QUESTION
30 sec • 1 pt
What is the relationship between velocity and position in terms of calculus?
Velocity is unrelated to position
Velocity is the integral of position
Velocity is the derivative of position
Velocity is the sum of position
7.
MULTIPLE CHOICE QUESTION
30 sec • 1 pt
What does the slope of the tangent line on a position curve represent?
Instantaneous velocity
Instantaneous acceleration
Total distance
Total time
Access all questions and much more by creating a free account
Create resources
Host any resource
Get auto-graded reports
Continue with Google

Continue with Email
Continue with Classlink
Continue with Clever
or continue with
Microsoft
%20(1).png)
Apple
Others
Already have an account?
