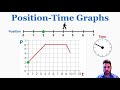
Mastering Position Time Graphs and Motion Analysis
Interactive Video
•
Physics, Mathematics, Science
•
9th - 12th Grade
•
Practice Problem
•
Hard

Patricia Brown
FREE Resource
Read more
10 questions
Show all answers
1.
MULTIPLE CHOICE QUESTION
30 sec • 1 pt
What does the y-axis represent in a position-time graph?
Velocity
Time
Acceleration
Position
2.
MULTIPLE CHOICE QUESTION
30 sec • 1 pt
If a person starts at position 3 and moves to position 6 in 3 seconds, what is their velocity?
1 meter per second
2 meters per second
0.5 meters per second
3 meters per second
3.
MULTIPLE CHOICE QUESTION
30 sec • 1 pt
What is the y-intercept of a position-time graph?
The average velocity of the object
The starting position of the object
The final position of the object
The total distance traveled by the object
4.
MULTIPLE CHOICE QUESTION
30 sec • 1 pt
How is velocity represented on a position-time graph?
By the length of the graph
By the slope of the graph
By the area under the graph
By the y-intercept
5.
MULTIPLE CHOICE QUESTION
30 sec • 1 pt
What does a flat line on a position-time graph indicate about the object's motion?
The object is accelerating
The object is moving at a constant speed
The object is stationary
The object is moving backward
6.
MULTIPLE CHOICE QUESTION
30 sec • 1 pt
If an object moves down 6 meters in 3 seconds, what is its velocity?
1 meter per second
-1 meter per second
-2 meters per second
2 meters per second
7.
MULTIPLE CHOICE QUESTION
30 sec • 1 pt
How do you calculate the total distance traveled on a position-time graph?
By measuring the y-intercept
By adding up all the individual distances traveled
By calculating the area under the graph
By finding the slope of the graph
Access all questions and much more by creating a free account
Create resources
Host any resource
Get auto-graded reports
Continue with Google

Continue with Email
Continue with Classlink
Continue with Clever
or continue with
Microsoft
%20(1).png)
Apple
Others
Already have an account?
Popular Resources on Wayground

15 questions
Fractions on a Number Line
Quiz
•
3rd Grade
20 questions
Equivalent Fractions
Quiz
•
3rd Grade
25 questions
Multiplication Facts
Quiz
•
5th Grade
54 questions
Analyzing Line Graphs & Tables
Quiz
•
4th Grade
22 questions
fractions
Quiz
•
3rd Grade
20 questions
Main Idea and Details
Quiz
•
5th Grade
20 questions
Context Clues
Quiz
•
6th Grade
15 questions
Equivalent Fractions
Quiz
•
4th Grade
Discover more resources for Physics
27 questions
Simple Machines and Mechanical Advantage Quiz
Quiz
•
9th Grade
16 questions
Coulomb's Law
Quiz
•
11th Grade
10 questions
Understanding Heat, Thermal Energy, and Temperature
Interactive video
•
9th - 10th Grade
10 questions
Newton's Laws of Motion
Quiz
•
10th Grade
10 questions
unit 10 -- electric forces and fields
Lesson
•
9th - 12th Grade
21 questions
Diffraction, Reflection, Refraction
Quiz
•
9th - 12th Grade
15 questions
Position vs. Time and Velocity vs. Time Graphs
Quiz
•
10th - 12th Grade
10 questions
Types of Chemical Reactions
Quiz
•
10th Grade