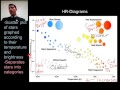
HR Diagram and Stellar Properties
Interactive Video
•
Science, Physics, Other
•
9th - 12th Grade
•
Practice Problem
•
Hard

Patricia Brown
FREE Resource
Read more
10 questions
Show all answers
1.
MULTIPLE CHOICE QUESTION
30 sec • 1 pt
What is the primary focus of the HR Diagram discussed in the video?
Classifying stars based on their chemical composition
Classifying stars based on their age
Classifying stars based on their luminosity and temperature
Classifying stars based on their distance from Earth
2.
MULTIPLE CHOICE QUESTION
30 sec • 1 pt
On the HR Diagram, how is the x-axis oriented?
Temperature decreases from right to left
Temperature increases from left to right
Temperature decreases from left to right
Temperature increases from right to left
3.
MULTIPLE CHOICE QUESTION
30 sec • 1 pt
Which quadrant of the HR Diagram contains the hottest and brightest stars?
Upper left
Lower left
Lower right
Upper right
4.
MULTIPLE CHOICE QUESTION
30 sec • 1 pt
What happens to a star when it runs out of hydrogen to fuse?
It becomes a white dwarf
It becomes a neutron star
It becomes a blue giant
It becomes a red giant
5.
MULTIPLE CHOICE QUESTION
30 sec • 1 pt
What is the relationship between a star's size and its brightness?
Size does not affect brightness
Larger stars are brighter
Larger stars are dimmer
Smaller stars are brighter
6.
MULTIPLE CHOICE QUESTION
30 sec • 1 pt
How can the age of a star be determined using the HR Diagram?
By its color
By its position on the diagram
By its distance from Earth
By its size
7.
MULTIPLE CHOICE QUESTION
30 sec • 1 pt
What does the Y-axis on an HR Diagram represent?
Age of the star
Temperature
Luminosity or brightness
Distance from Earth
Access all questions and much more by creating a free account
Create resources
Host any resource
Get auto-graded reports
Continue with Google

Continue with Email
Continue with Classlink
Continue with Clever
or continue with
Microsoft
%20(1).png)
Apple
Others
Already have an account?
