Understanding LD50 and Dose Response Curves
Interactive Video
•
Chemistry, Biology, Science
•
9th - 12th Grade
•
Practice Problem
•
Hard

Patricia Brown
FREE Resource
Read more
10 questions
Show all answers
1.
MULTIPLE CHOICE QUESTION
30 sec • 1 pt
What is the primary focus of this lesson?
The benefits of chemicals
The economic impact of chemicals
Lethal doses and dose response curves
The history of chemical usage
2.
MULTIPLE CHOICE QUESTION
30 sec • 1 pt
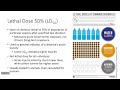
What does LD50 stand for?
Lethal Dose 25%
Lethal Dose 100%
Lethal Dose 50%
Lethal Dose 75%
3.
MULTIPLE CHOICE QUESTION
30 sec • 1 pt
Why is there controversy surrounding LD50 testing?
It takes too long
It is not accurate
It is too expensive
It uses animals in research
4.
MULTIPLE CHOICE QUESTION
30 sec • 1 pt
What is a limitation of the LD50 measurement?
It is not used for animals
It is not used for humans
It only measures acute exposure
It only measures chronic exposure
5.
MULTIPLE CHOICE QUESTION
30 sec • 1 pt
What does LC50 measure?
Lethal concentration in soil
Lethal concentration in water or air
Lethal concentration in food
Lethal concentration in humans
6.
MULTIPLE CHOICE QUESTION
30 sec • 1 pt
What is a dose response curve used for?
To assess the environmental impact of chemicals
To calculate the cost of chemical production
To determine the safe concentration of chemicals
To measure the economic impact of chemicals
7.
MULTIPLE CHOICE QUESTION
30 sec • 1 pt
What does the x-axis on a dose response curve typically represent?
Dose
Temperature
Concentration
Time
Access all questions and much more by creating a free account
Create resources
Host any resource
Get auto-graded reports
Continue with Google

Continue with Email
Continue with Classlink
Continue with Clever
or continue with
Microsoft
%20(1).png)
Apple
Others
Already have an account?
