Graph Interpretation and Fish Ecology
Interactive Video
•
Biology, Science, Mathematics
•
9th - 10th Grade
•
Practice Problem
•
Hard

Patricia Brown
FREE Resource
Read more
10 questions
Show all answers
1.
MULTIPLE CHOICE QUESTION
30 sec • 1 pt
What are some of the factors contributing to the decline of steelhead trout populations?
Natural disasters and disease
Lack of food and predators
Pollution, climate change, and invasive species
Overfishing and habitat destruction
2.
MULTIPLE CHOICE QUESTION
30 sec • 1 pt
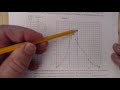
In the first graph, what is the independent variable?
Number of fish
Time of year
Water temperature
Dissolved oxygen
3.
MULTIPLE CHOICE QUESTION
30 sec • 1 pt
How is the range for the x-axis determined in the first graph?
By counting the number of fish
By measuring the water temperature
By dividing the range by the number of lines
By estimating the average temperature
4.
MULTIPLE CHOICE QUESTION
30 sec • 1 pt
What is the shape of the best fit line in the first graph?
Straight line
Exponential curve
Zigzag pattern
Bell curve
5.
MULTIPLE CHOICE QUESTION
30 sec • 1 pt
What is the zone called where the abiotic factors are too extreme for most fish to survive?
Optimum range
Zone of intolerance
Comfort zone
Zone of physiological stress
6.
MULTIPLE CHOICE QUESTION
30 sec • 1 pt
What is the purpose of dividing the graph into different zones?
To make the graph look more complex
To identify areas of high and low fish survival
To separate different species of fish
To highlight the most colorful parts of the graph
7.
MULTIPLE CHOICE QUESTION
30 sec • 1 pt
What is the independent variable in the second graph?
Number of fish
Water temperature
Time of day
Dissolved oxygen
Access all questions and much more by creating a free account
Create resources
Host any resource
Get auto-graded reports
Continue with Google

Continue with Email
Continue with Microsoft
or continue with

%20(1).png)
Apple
Others
Already have an account?
