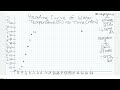
Heating Curve of Water Concepts
Interactive Video
•
Physics, Chemistry, Science
•
6th - 8th Grade
•
Practice Problem
•
Hard

Patricia Brown
FREE Resource
Read more
10 questions
Show all answers
1.
MULTIPLE CHOICE QUESTION
30 sec • 1 pt
What is the independent variable in the heating curve of water?
Temperature
Time
Pressure
Volume
2.
MULTIPLE CHOICE QUESTION
30 sec • 1 pt
How many boxes represent one minute on the x-axis?
0.5 boxes
1 box
2 boxes
1.35 boxes
3.
MULTIPLE CHOICE QUESTION
30 sec • 1 pt
What is the temperature change per box on the y-axis after rounding?
5°C
4.14°C
1°C
10°C
4.
MULTIPLE CHOICE QUESTION
30 sec • 1 pt
At what temperature did the graph flatline during the experiment?
100°C
116°C
99°C
0°C
5.
MULTIPLE CHOICE QUESTION
30 sec • 1 pt
What is the boiling point of water in this experiment?
99°C
100°C
101°C
98°C
6.
MULTIPLE CHOICE QUESTION
30 sec • 1 pt
Why might the boiling point be observed at 99°C instead of 100°C?
Measurement error
External pressure
Impurities in water
Incorrect graph setup
7.
MULTIPLE CHOICE QUESTION
30 sec • 1 pt
What phase change occurs at 0°C?
Condensation
Boiling
Melting
Freezing
Access all questions and much more by creating a free account
Create resources
Host any resource
Get auto-graded reports
Continue with Google

Continue with Email
Continue with Classlink
Continue with Clever
or continue with
Microsoft
%20(1).png)
Apple
Others
Already have an account?
