Scatter Plots and Predictions
Interactive Video
•
Mathematics, Science, Other
•
9th - 12th Grade
•
Practice Problem
•
Hard

Patricia Brown
FREE Resource
Read more
10 questions
Show all answers
1.
MULTIPLE CHOICE QUESTION
30 sec • 1 pt
What is the primary purpose of using scatter plots and lines of best fit?
To create artistic designs
To calculate the area of a shape
To measure the speed of an object
To predict values within a relationship
2.
MULTIPLE CHOICE QUESTION
30 sec • 1 pt
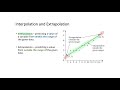
What is interpolation?
A technique to measure data accuracy
Predicting values outside the data range
Predicting values within the given data range
A method to draw scatter plots
3.
MULTIPLE CHOICE QUESTION
30 sec • 1 pt
What is extrapolation?
A technique to measure data accuracy
A method to draw scatter plots
Predicting values outside the given data range
Predicting values within the data range
4.
MULTIPLE CHOICE QUESTION
30 sec • 1 pt
Why are predictions made using extrapolation considered less reliable?
They require complex calculations
They are outside the given data range
They are based on fewer data points
They are always incorrect
5.
MULTIPLE CHOICE QUESTION
30 sec • 1 pt
How does the size of a data set affect the reliability of predictions?
Larger data sets make predictions less reliable
Smaller data sets make predictions more reliable
Larger data sets make predictions more reliable
The size of the data set has no effect
6.
MULTIPLE CHOICE QUESTION
30 sec • 1 pt
What factor strengthens the reliability of predictions?
Ignoring outliers
A strong relationship between variables
A weak relationship between variables
Using fewer data points
7.
MULTIPLE CHOICE QUESTION
30 sec • 1 pt
In the example, what is the predicted value of y when x is 10?
35
14
10
27
Access all questions and much more by creating a free account
Create resources
Host any resource
Get auto-graded reports
Continue with Google

Continue with Email
Continue with Classlink
Continue with Clever
or continue with
Microsoft
%20(1).png)
Apple
Others
Already have an account?
