Statistical Distributions and Analysis Concepts
Interactive Video
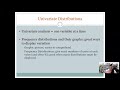
•
Mathematics, Science, Social Studies
•
10th - 12th Grade
•
Practice Problem
•
Hard

Patricia Brown
FREE Resource
Read more
10 questions
Show all answers
1.
MULTIPLE CHOICE QUESTION
30 sec • 1 pt
What does a univariate analysis focus on?
Predicting future trends
Analyzing multiple variables simultaneously
Examining one variable at a time
Determining statistical significance
2.
MULTIPLE CHOICE QUESTION
30 sec • 1 pt
Which of the following is a method to display univariate measures?
Frequency distributions
Scatter plots
Correlation matrices
Regression analysis
3.
MULTIPLE CHOICE QUESTION
30 sec • 1 pt
Why are univariate analyses important before deeper analysis?
To calculate statistical significance
To ensure the sample is representative of the population
To establish causal relationships
To predict future outcomes
4.
MULTIPLE CHOICE QUESTION
30 sec • 1 pt
What is a key advantage of using frequency distributions over graphs?
They are more colorful
They provide a visual representation
They are easier to interpret
They summarize multiple variables efficiently
5.
MULTIPLE CHOICE QUESTION
30 sec • 1 pt
What does central tendency describe in a distribution?
The spread of data points
The most common or middle value
The direction of skewness
The flatness of the distribution
6.
MULTIPLE CHOICE QUESTION
30 sec • 1 pt
Which feature of a distribution indicates how data points are spread out?
Skewness
Kurtosis
Variability
Central tendency
7.
MULTIPLE CHOICE QUESTION
30 sec • 1 pt
What does skewness in a distribution refer to?
The central value of the data
The spread of data points
The extent to which data is clustered at one end
The height of the distribution peak
Access all questions and much more by creating a free account
Create resources
Host any resource
Get auto-graded reports
Continue with Google

Continue with Email
Continue with Classlink
Continue with Clever
or continue with
Microsoft
%20(1).png)
Apple
Others
Already have an account?
Similar Resources on Wayground

6 questions
Scales of Analysis
Interactive video
•
9th - 12th Grade
11 questions
Sustainable Transportation and Energy Solutions
Interactive video
•
10th - 12th Grade
11 questions
Soft Starters and Direct Online Starters
Interactive video
•
9th - 12th Grade
11 questions
Exploring Research Methods in AP Psychology
Interactive video
•
9th - 12th Grade
11 questions
National Geographic Innovations and Achievements
Interactive video
•
9th - 12th Grade
Popular Resources on Wayground
7 questions
History of Valentine's Day
Interactive video
•
4th Grade
15 questions
Fractions on a Number Line
Quiz
•
3rd Grade
20 questions
Equivalent Fractions
Quiz
•
3rd Grade
25 questions
Multiplication Facts
Quiz
•
5th Grade
22 questions
fractions
Quiz
•
3rd Grade
15 questions
Valentine's Day Trivia
Quiz
•
3rd Grade
20 questions
Main Idea and Details
Quiz
•
5th Grade
20 questions
Context Clues
Quiz
•
6th Grade
Discover more resources for Mathematics
10 questions
Factor Quadratic Expressions with Various Coefficients
Quiz
•
9th - 12th Grade
10 questions
Elijah McCoy: Innovations and Impact in Black History
Interactive video
•
6th - 10th Grade
10 questions
Evaluating Piecewise Functions Practice
Quiz
•
11th Grade
5 questions
Triangle Congruence Theorems
Interactive video
•
9th - 12th Grade
15 questions
Module 3 Topic 1 Vocabulary Quiz
Quiz
•
10th Grade
16 questions
Circle Vocabulary
Quiz
•
9th - 10th Grade
15 questions
Exponential Growth and Decay Word Problems Practice
Quiz
•
9th - 12th Grade
10 questions
Multiplying Fractions with Area Models
Interactive video
•
6th - 10th Grade