Graph Analysis and Interpretation Concepts
Interactive Video
•
Geography
•
9th - 10th Grade
•
Practice Problem
•
Hard

Patricia Brown
FREE Resource
Read more
10 questions
Show all answers
1.
MULTIPLE CHOICE QUESTION
30 sec • 1 pt
Why is it important to know how to analyze graphs in exams?
Because they are the easiest to answer.
Because they are a common type of question in exams.
Because they are always the first question.
Because they are visually appealing.
2.
MULTIPLE CHOICE QUESTION
30 sec • 1 pt
What does the term 'trend' refer to in graph analysis?
A sudden drop in data.
A consistent pattern over time.
A random fluctuation.
A single data point.
3.
MULTIPLE CHOICE QUESTION
30 sec • 1 pt
What is an 'outlier' in the context of graph analysis?
A point that deviates significantly from the pattern.
A point that is an average of the data.
A point that fits the overall pattern.
A point that is the highest in the data set.
4.
MULTIPLE CHOICE QUESTION
30 sec • 1 pt
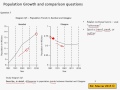
How does the population trend in Mumbai differ from that in Glasgow?
Mumbai's population is increasing, whereas Glasgow's is decreasing.
Both cities have a stable population trend.
Both cities have an increasing population trend.
Mumbai's population is decreasing while Glasgow's is increasing.
5.
MULTIPLE CHOICE QUESTION
30 sec • 1 pt
What is the significance of using the word 'whereas' in comparing graphs?
It indicates a similarity between two graphs.
It suggests that one graph is more important than the other.
It highlights a difference between two graphs.
It shows that both graphs are identical.
6.
MULTIPLE CHOICE QUESTION
30 sec • 1 pt
What structure should be used to describe a graph?
Where, when, and who.
What, when, and how much.
Who, where, and why.
Why, how, and what.
7.
MULTIPLE CHOICE QUESTION
30 sec • 1 pt
In the context of graph analysis, what does 'how much' refer to?
The total number of data points.
The location of the data collection.
The magnitude of change in the data.
The time period of the data.
Access all questions and much more by creating a free account
Create resources
Host any resource
Get auto-graded reports
Continue with Google

Continue with Email
Continue with Classlink
Continue with Clever
or continue with
Microsoft
%20(1).png)
Apple
Others
Already have an account?
Similar Resources on Wayground

6 questions
Find the parabola given the vertex and point
Interactive video
•
9th - 10th Grade
6 questions
These Countries Are The Least Populated In The World! | KLT
Interactive video
•
KG - 9th Grade
2 questions
New Zealand lifestyle
Interactive video
•
9th - 10th Grade
6 questions
Coronavirus Model Predicts U.S. Death Toll Of Over 200,000 By October
Interactive video
•
9th - 12th Grade
6 questions
Restoring Marine Life and Livelihoods: The Sustainable Transformation of Ryong
Interactive video
•
KG - University
6 questions
CLEAN : Polls show surge in support for French far right National Front
Interactive video
•
9th - 10th Grade
Popular Resources on Wayground
15 questions
Fractions on a Number Line
Quiz
•
3rd Grade
20 questions
Equivalent Fractions
Quiz
•
3rd Grade
25 questions
Multiplication Facts
Quiz
•
5th Grade
54 questions
Analyzing Line Graphs & Tables
Quiz
•
4th Grade
22 questions
fractions
Quiz
•
3rd Grade
20 questions
Main Idea and Details
Quiz
•
5th Grade
20 questions
Context Clues
Quiz
•
6th Grade
15 questions
Equivalent Fractions
Quiz
•
4th Grade
Discover more resources for Geography
45 questions
Unit 9 Europe Review
Quiz
•
9th Grade
25 questions
Population and Demography Quiz
Quiz
•
9th Grade
14 questions
Russia lesson 2 p363-371
Quiz
•
9th Grade
17 questions
Russia Lesson 3
Quiz
•
9th Grade
20 questions
AP Human Geography Unit 5
Quiz
•
10th Grade
11 questions
How do volcanoes and earthquakes happen?
Passage
•
9th Grade
15 questions
Population Pyramid
Quiz
•
9th Grade
30 questions
Unit 5 Exam: Russia and Central Asia
Quiz
•
10th Grade