Density Measurement and Graphing Techniques
Interactive Video
•
Mathematics, Science, Computers
•
9th - 12th Grade
•
Practice Problem
•
Hard

Patricia Brown
FREE Resource
Read more
10 questions
Show all answers
1.
MULTIPLE CHOICE QUESTION
30 sec • 1 pt
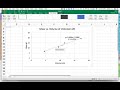
What issue arises with Google Sheets when creating a density graph?
It automatically adds a trendline that cannot be removed.
It creates a bar chart instead of a scatterplot.
It plots points with equal horizontal spacing, not reflecting true data.
It does not allow for any graph creation.
2.
MULTIPLE CHOICE QUESTION
30 sec • 1 pt
Which chart type should be selected in Excel to create a proper scatterplot?
Line Chart
Pie Chart
Bar Chart
XY Scatter Chart
3.
MULTIPLE CHOICE QUESTION
30 sec • 1 pt
Why is it important to label axes and titles in scientific graphs?
To make the graph look more colorful.
To comply with software requirements.
To ensure the graph is aesthetically pleasing.
To provide clarity and understanding of the data.
4.
MULTIPLE CHOICE QUESTION
30 sec • 1 pt
What does the slope of the line in a scatterplot represent in the context of density?
The total mass of the objects.
The volume of the liquid used.
The density of the unknown sample.
The average temperature of the environment.
5.
MULTIPLE CHOICE QUESTION
30 sec • 1 pt
How many significant figures should be used when reporting the density in this context?
Four significant figures
Three significant figures
Two significant figures
One significant figure
6.
MULTIPLE CHOICE QUESTION
30 sec • 1 pt
What does an R-squared value close to 1 indicate about the data?
The data is perfectly accurate.
The data is highly inaccurate.
The data is completely random.
The data is very precise.
7.
MULTIPLE CHOICE QUESTION
30 sec • 1 pt
Which software is recommended for creating density graphs if not using Google Sheets?
Microsoft Word
Microsoft Excel
Adobe Photoshop
Notepad
Access all questions and much more by creating a free account
Create resources
Host any resource
Get auto-graded reports
Continue with Google

Continue with Email
Continue with Classlink
Continue with Clever
or continue with
Microsoft
%20(1).png)
Apple
Others
Already have an account?
