Hypothesis Testing and P-Values
Interactive Video
•
Mathematics, Science, Statistics
•
9th - 12th Grade
•
Practice Problem
•
Hard

Patricia Brown
FREE Resource
Read more
10 questions
Show all answers
1.
MULTIPLE CHOICE QUESTION
30 sec • 1 pt
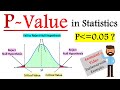
What is the p-value in statistical hypothesis testing?
A probability measure between 0 and 1
A measure of data dispersion
A type of statistical error
A measure of central tendency
2.
MULTIPLE CHOICE QUESTION
30 sec • 1 pt
In the context of a coin flip experiment, what does a small p-value indicate?
The experiment is invalid
The results are inconclusive
The coin is biased
The coin is fair
3.
MULTIPLE CHOICE QUESTION
30 sec • 1 pt
What is the significance level in hypothesis testing?
The probability of accepting a false null hypothesis
The probability of rejecting a true null hypothesis
The probability of a Type II error
The probability of a Type I error
4.
MULTIPLE CHOICE QUESTION
30 sec • 1 pt
When do we reject the null hypothesis based on p-value?
When p-value is greater than the significance level
When p-value is less than the significance level
When p-value equals the significance level
When p-value is zero
5.
MULTIPLE CHOICE QUESTION
30 sec • 1 pt
In the example of the average weight of boxes, what was the null hypothesis?
The average weight is greater than 1.84 kg
The average weight is less than 1.84 kg
The average weight is not equal to 1.84 kg
The average weight is equal to 1.84 kg
6.
MULTIPLE CHOICE QUESTION
30 sec • 1 pt
What was the calculated p-value in the single population mean example?
0.857
0.1423
0.05
1.07
7.
MULTIPLE CHOICE QUESTION
30 sec • 1 pt
In the population proportion example, what was the null hypothesis?
The proportion is not equal to 6.9%
The proportion is less than 6.9%
The proportion is greater than 6.9%
The proportion is equal to 6.9%
Access all questions and much more by creating a free account
Create resources
Host any resource
Get auto-graded reports
Continue with Google

Continue with Email
Continue with Classlink
Continue with Clever
or continue with
Microsoft
%20(1).png)
Apple
Others
Already have an account?
