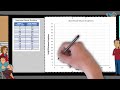
Geyser Eruption Data Analysis
Interactive Video
•
Mathematics, Science, Other
•
6th - 7th Grade
•
Practice Problem
•
Hard

Patricia Brown
FREE Resource
Read more
10 questions
Show all answers
1.
MULTIPLE CHOICE QUESTION
30 sec • 1 pt
What is the main focus of the video tutorial?
Learning a new language
Building a house
Representing data on a scatter plot
How to cook a meal
2.
MULTIPLE CHOICE QUESTION
30 sec • 1 pt
Where is the Steamboat Geyser located?
Mount Everest
Niagara Falls
Yellowstone Park
Grand Canyon
3.
MULTIPLE CHOICE QUESTION
30 sec • 1 pt
What does the first column in the data represent?
Height of geyser
Temperature of water
Color of steam
Length of eruption
4.
MULTIPLE CHOICE QUESTION
30 sec • 1 pt
How is the length between eruptions measured?
In hours
In seconds
In minutes
In days
5.
MULTIPLE CHOICE QUESTION
30 sec • 1 pt
What is the label for the x-axis on the scatter plot?
Length of eruption
Length between eruptions
Temperature
Height
6.
MULTIPLE CHOICE QUESTION
30 sec • 1 pt
How long did the first eruption last according to the data?
42 minutes
3 minutes
5 minutes
10 minutes
7.
MULTIPLE CHOICE QUESTION
30 sec • 1 pt
For how many days did the geyser not erupt after a 3-minute eruption?
65 days
19 days
18 days
10 days
Create a free account and access millions of resources
Create resources
Host any resource
Get auto-graded reports
Continue with Google

Continue with Email
Continue with Classlink
Continue with Clever
or continue with
Microsoft
%20(1).png)
Apple
Others
Already have an account?
Similar Resources on Wayground
Popular Resources on Wayground

5 questions
This is not a...winter edition (Drawing game)
Quiz
•
1st - 5th Grade
15 questions
4:3 Model Multiplication of Decimals by Whole Numbers
Quiz
•
5th Grade
25 questions
Multiplication Facts
Quiz
•
5th Grade
10 questions
The Best Christmas Pageant Ever Chapters 1 & 2
Quiz
•
4th Grade
12 questions
Unit 4 Review Day
Quiz
•
3rd Grade
10 questions
Identify Iconic Christmas Movie Scenes
Interactive video
•
6th - 10th Grade
20 questions
Christmas Trivia
Quiz
•
6th - 8th Grade
18 questions
Kids Christmas Trivia
Quiz
•
KG - 5th Grade
Discover more resources for Mathematics
10 questions
Identify Iconic Christmas Movie Scenes
Interactive video
•
6th - 10th Grade
21 questions
Convert Fractions, Decimals, and Percents
Quiz
•
6th Grade
20 questions
Exponents
Quiz
•
6th Grade
20 questions
One step Equations
Quiz
•
6th Grade
15 questions
Christmas Movie Trivia
Quiz
•
7th Grade
24 questions
Evaluate and Simplify Algebraic Expressions
Quiz
•
6th Grade
20 questions
One-Step Inequalities
Quiz
•
7th Grade
20 questions
Percents
Quiz
•
6th Grade