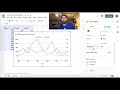
Graph Customization and Data Representation
Interactive Video
•
Mathematics, Computers, Science
•
6th - 7th Grade
•
Practice Problem
•
Hard

Patricia Brown
FREE Resource
Read more
10 questions
Show all answers
1.
MULTIPLE CHOICE QUESTION
30 sec • 1 pt
What is the main purpose of the video tutorial?
To demonstrate how to use Google Sheets for calculations.
To discuss the ecological impact of predators.
To teach how to create a graph using predator-prey data.
To explain the history of moose and wolves.
2.
MULTIPLE CHOICE QUESTION
30 sec • 1 pt
Which data is entered into the first column of the Google Sheet?
Number of wolves
Population growth rate
Number of moose
Years
3.
MULTIPLE CHOICE QUESTION
30 sec • 1 pt
What is the first step in creating a graph after entering the data?
Inserting a new sheet
Changing the chart type
Highlighting the data
Clicking on the 'File' menu
4.
MULTIPLE CHOICE QUESTION
30 sec • 1 pt
Why is it important to customize the graph?
To make it look more colorful
To change the data source
To accurately represent the data
To add more data points
5.
MULTIPLE CHOICE QUESTION
30 sec • 1 pt
What customization is made to better display the wolves' data?
Changing the chart type to a bar chart
Adding a secondary y-axis for wolves
Increasing the font size of labels
Changing the color of the moose data
6.
MULTIPLE CHOICE QUESTION
30 sec • 1 pt
What does the cyclical nature of the population growth indicate?
The moose population always decreases
The wolves' population is constant
Both populations rise and fall over time
The moose population is unaffected by wolves
7.
MULTIPLE CHOICE QUESTION
30 sec • 1 pt
What is the effect of giving wolves their own axis?
It makes the graph more colorful
It shows the wolves' data more clearly
It changes the data source
It reduces the size of the graph
Access all questions and much more by creating a free account
Create resources
Host any resource
Get auto-graded reports
Continue with Google

Continue with Email
Continue with Classlink
Continue with Clever
or continue with
Microsoft
%20(1).png)
Apple
Others
Already have an account?
Popular Resources on Wayground

15 questions
Fractions on a Number Line
Quiz
•
3rd Grade
20 questions
Equivalent Fractions
Quiz
•
3rd Grade
25 questions
Multiplication Facts
Quiz
•
5th Grade
54 questions
Analyzing Line Graphs & Tables
Quiz
•
4th Grade
22 questions
fractions
Quiz
•
3rd Grade
20 questions
Main Idea and Details
Quiz
•
5th Grade
20 questions
Context Clues
Quiz
•
6th Grade
15 questions
Equivalent Fractions
Quiz
•
4th Grade
Discover more resources for Mathematics
22 questions
distributive property
Quiz
•
7th Grade
18 questions
Angle Relationships
Quiz
•
7th Grade
15 questions
Distributive Property & Review
Quiz
•
6th Grade
20 questions
Writing Algebraic Expressions
Quiz
•
6th Grade
20 questions
How Some Friendships Last — and Others Don’t Video Questions
Quiz
•
7th Grade
20 questions
Ratios/Rates and Unit Rates
Quiz
•
6th Grade
18 questions
Handbook Refresher Quiz
Quiz
•
7th Grade
20 questions
Graphing Inequalities on a Number Line
Quiz
•
6th - 9th Grade