Standard Curve and Absorbance Analysis
Interactive Video
•
Chemistry, Science, Computers
•
10th - 12th Grade
•
Practice Problem
•
Hard

Patricia Brown
FREE Resource
Read more
10 questions
Show all answers
1.
MULTIPLE CHOICE QUESTION
30 sec • 1 pt
What is the first step in creating a standard curve using absorbance and concentration?
Measuring the concentration of unknown samples
Calculating the average absorbance
Measuring the concentration of standard samples
Creating a scatter plot in Excel
2.
MULTIPLE CHOICE QUESTION
30 sec • 1 pt
Why is it important to measure absorbance multiple times for each sample?
To increase the concentration of the sample
To ensure the equipment is working
To account for technical replicates
To save time in the experiment
3.
MULTIPLE CHOICE QUESTION
30 sec • 1 pt
How do you calculate the average absorbance for a sample?
By subtracting the lowest absorbance from the highest
By adding the absorbance values and dividing by two
By multiplying the absorbance values
By taking the square root of the absorbance values
4.
MULTIPLE CHOICE QUESTION
30 sec • 1 pt
What is the purpose of subtracting the absorbance of the zero concentration standard?
To simplify the calculations
To increase the absorbance values
To account for background absorbance
To eliminate the need for a trendline
5.
MULTIPLE CHOICE QUESTION
30 sec • 1 pt
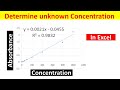
Which Excel feature is used to create a standard curve from absorbance and concentration data?
Line graph
Pie chart
Bar chart
Scatter plot
6.
MULTIPLE CHOICE QUESTION
30 sec • 1 pt
What does the trendline equation on the standard curve represent?
The relationship between absorbance and time
The relationship between concentration and time
The relationship between absorbance and concentration
The relationship between concentration and temperature
7.
MULTIPLE CHOICE QUESTION
30 sec • 1 pt
In the equation from the standard curve, what does 'Y' represent?
The absorbance of unknown samples
The temperature of the solution
The concentration of unknown samples
The time of measurement
Access all questions and much more by creating a free account
Create resources
Host any resource
Get auto-graded reports
Continue with Google

Continue with Email
Continue with Classlink
Continue with Clever
or continue with
Microsoft
%20(1).png)
Apple
Others
Already have an account?
Popular Resources on Wayground

8 questions
Spartan Way - Classroom Responsible
Quiz
•
9th - 12th Grade
15 questions
Fractions on a Number Line
Quiz
•
3rd Grade
14 questions
Boundaries & Healthy Relationships
Lesson
•
6th - 8th Grade
20 questions
Equivalent Fractions
Quiz
•
3rd Grade
3 questions
Integrity and Your Health
Lesson
•
6th - 8th Grade
25 questions
Multiplication Facts
Quiz
•
5th Grade
9 questions
FOREST Perception
Lesson
•
KG
20 questions
Main Idea and Details
Quiz
•
5th Grade
Discover more resources for Chemistry
22 questions
Unit 9 Gas Law Quiz
Quiz
•
10th Grade
20 questions
Types of Chemical Reactions
Quiz
•
9th - 12th Grade
13 questions
Solubility Curves
Quiz
•
10th Grade
20 questions
momentum and impulse
Quiz
•
9th - 12th Grade
22 questions
Solubility Curve Practice
Quiz
•
10th Grade
40 questions
Unit 3 (Part 1) Chemical Equations & Reactions Review Game
Quiz
•
8th - 12th Grade
20 questions
Naming Covalent Compounds
Quiz
•
11th Grade
35 questions
Types of Chemical Reactions
Quiz
•
9th - 12th Grade