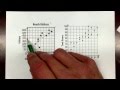
Scatter Plots and Predictions
Interactive Video
•
Mathematics
•
9th - 10th Grade
•
Practice Problem
•
Hard

Patricia Brown
FREE Resource
Read more
10 questions
Show all answers
1.
MULTIPLE CHOICE QUESTION
30 sec • 1 pt
What is the main topic of Mr. Herman's video?
Pie Charts and Data Analysis
Scatter Plots and Lines of Best Fit
Probability and Statistics
Bar Graphs and Histograms
2.
MULTIPLE CHOICE QUESTION
30 sec • 1 pt
What can students use to create scatter plots according to the video?
A handout from the website
A smartphone app
A calculator
A textbook
3.
MULTIPLE CHOICE QUESTION
30 sec • 1 pt
Why does Mr. Herman suggest using plastic pieces for drawing lines of best fit?
They are easier to hold
They are cheaper than rulers
They are more colorful
They allow you to see both sides of the line
4.
MULTIPLE CHOICE QUESTION
30 sec • 1 pt
What is the correlation between temperature and beach visitors?
Inverse correlation
Positive correlation
No correlation
Negative correlation
5.
MULTIPLE CHOICE QUESTION
30 sec • 1 pt
How many points does Mr. Herman aim to have on each side of the line of best fit for the temperature and visitors scatter plot?
Nine
Seven
Five
Three
6.
MULTIPLE CHOICE QUESTION
30 sec • 1 pt
What prediction does Mr. Herman make for a 90° day in terms of visitors?
About 300 visitors
About 600 visitors
About 405 visitors
About 500 visitors
7.
MULTIPLE CHOICE QUESTION
30 sec • 1 pt
What is the relationship between hours of sleep and test scores?
Negative correlation
Inverse correlation
No correlation
Positive correlation
Access all questions and much more by creating a free account
Create resources
Host any resource
Get auto-graded reports
Continue with Google

Continue with Email
Continue with Classlink
Continue with Clever
or continue with
Microsoft
%20(1).png)
Apple
Others
Already have an account?
