Understanding Data Distributions and Measures
Interactive Video
•
Mathematics, Science, Other
•
9th - 10th Grade
•
Practice Problem
•
Hard

Patricia Brown
FREE Resource
Read more
10 questions
Show all answers
1.
MULTIPLE CHOICE QUESTION
30 sec • 1 pt
What is the primary focus of the video tutorial?
Comparing histograms to pie charts
Exploring line graphs
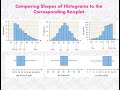
Understanding the shapes of histograms and box plots
Learning about bar graphs
2.
MULTIPLE CHOICE QUESTION
30 sec • 1 pt
In a symmetric distribution, how do the mean and median compare?
The mean is always greater than the median
The mean is always less than the median
The mean and median are unrelated
The mean and median are the same
3.
MULTIPLE CHOICE QUESTION
30 sec • 1 pt
What does a right-skewed distribution indicate about the data?
More data is concentrated on the right
Data trails off to the right
Data is evenly distributed
More data is concentrated on the left
4.
MULTIPLE CHOICE QUESTION
30 sec • 1 pt
In a right-skewed box plot, what does a longer whisker on the right indicate?
More data is on the right
Data is more compact on the right
Data is evenly distributed
Data is more spread out on the right
5.
MULTIPLE CHOICE QUESTION
30 sec • 1 pt
How can you identify a left-skewed distribution in a histogram?
The bars are evenly distributed
The bars are lower on the left
The bars are higher on the left
The bars are higher on the right
6.
MULTIPLE CHOICE QUESTION
30 sec • 1 pt
What does a wider box in a box plot indicate about the data?
Data is skewed
Data is more compact
Data is more spread out
Data is evenly distributed
7.
MULTIPLE CHOICE QUESTION
30 sec • 1 pt
In a left-skewed distribution, where is the median typically located?
Outside the range
Closer to the maximum
Exactly in the middle
Closer to the minimum
Access all questions and much more by creating a free account
Create resources
Host any resource
Get auto-graded reports
Continue with Google

Continue with Email
Continue with Classlink
Continue with Clever
or continue with
Microsoft
%20(1).png)
Apple
Others
Already have an account?
Popular Resources on Wayground

15 questions
Fractions on a Number Line
Quiz
•
3rd Grade
20 questions
Equivalent Fractions
Quiz
•
3rd Grade
25 questions
Multiplication Facts
Quiz
•
5th Grade
29 questions
Alg. 1 Section 5.1 Coordinate Plane
Quiz
•
9th Grade
22 questions
fractions
Quiz
•
3rd Grade
11 questions
FOREST Effective communication
Lesson
•
KG
20 questions
Main Idea and Details
Quiz
•
5th Grade
20 questions
Context Clues
Quiz
•
6th Grade
Discover more resources for Mathematics
29 questions
Alg. 1 Section 5.1 Coordinate Plane
Quiz
•
9th Grade
20 questions
Graphing Inequalities on a Number Line
Quiz
•
6th - 9th Grade
20 questions
Box and Whisker Plots
Quiz
•
9th Grade
18 questions
Exponential Growth and Decay
Quiz
•
9th Grade
20 questions
Function or Not a Function
Quiz
•
8th - 9th Grade
20 questions
SSS/SAS
Quiz
•
9th - 12th Grade
14 questions
Making Inferences From Samples
Quiz
•
7th - 12th Grade
23 questions
CCG - CH8 Polygon angles and area Review
Quiz
•
9th - 12th Grade