Solubility and Temperature Relationships
Interactive Video
•
Chemistry, Science, Mathematics
•
9th - 10th Grade
•
Practice Problem
•
Hard

Patricia Brown
FREE Resource
Read more
10 questions
Show all answers
1.
MULTIPLE CHOICE QUESTION
30 sec • 1 pt
What does the x-axis represent on a solubility curve?
Volume of solvent
Temperature
Amount in grams
Type of solute
2.
MULTIPLE CHOICE QUESTION
30 sec • 1 pt
How many grams of calcium chloride can be dissolved at 20°C?
25 grams
100 grams
75 grams
50 grams
3.
MULTIPLE CHOICE QUESTION
30 sec • 1 pt
At what temperature can 40 grams of potassium chloride be dissolved?
50°C
35°C
42°C
30°C
4.
MULTIPLE CHOICE QUESTION
30 sec • 1 pt
Which substance is most soluble at 90°C?
Potassium chloride
Calcium chloride
Sodium chloride
Potassium dichromate
5.
MULTIPLE CHOICE QUESTION
30 sec • 1 pt
Which substance is least soluble at 10°C?
Potassium chlorate
Sodium chloride
Potassium dichromate
Calcium chloride
6.
MULTIPLE CHOICE QUESTION
30 sec • 1 pt
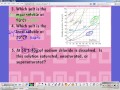
What does it mean if a solution is supersaturated?
The dot is above the line
The dot is not on the graph
The dot is below the line
The dot is on the line
7.
MULTIPLE CHOICE QUESTION
30 sec • 1 pt
If a solution is unsaturated, where would the dot be on the graph?
Not on the graph
Below the line
Above the line
On the line
Access all questions and much more by creating a free account
Create resources
Host any resource
Get auto-graded reports
Continue with Google

Continue with Email
Continue with Classlink
Continue with Clever
or continue with
Microsoft
%20(1).png)
Apple
Others
Already have an account?
Similar Resources on Wayground

11 questions
Graphing Complex Numbers and Concepts
Interactive video
•
9th - 10th Grade
11 questions
Triangles and Their Properties
Interactive video
•
9th - 10th Grade
11 questions
Understanding Piecewise Defined Functions
Interactive video
•
8th - 10th Grade
11 questions
Bone Health and Osteoporosis Concepts
Interactive video
•
9th - 10th Grade
8 questions
Halogen Compounds:Methods of Preparation
Interactive video
•
10th - 12th Grade
11 questions
Understanding Systems of Linear Equations
Interactive video
•
7th - 10th Grade
8 questions
Shortest Distance Between Two Lines in Space
Interactive video
•
9th - 10th Grade
11 questions
Understanding Functions and Their Properties
Interactive video
•
9th - 10th Grade
Popular Resources on Wayground
8 questions
Spartan Way - Classroom Responsible
Quiz
•
9th - 12th Grade
15 questions
Fractions on a Number Line
Quiz
•
3rd Grade
14 questions
Boundaries & Healthy Relationships
Lesson
•
6th - 8th Grade
20 questions
Equivalent Fractions
Quiz
•
3rd Grade
3 questions
Integrity and Your Health
Lesson
•
6th - 8th Grade
25 questions
Multiplication Facts
Quiz
•
5th Grade
9 questions
FOREST Perception
Lesson
•
KG
20 questions
Main Idea and Details
Quiz
•
5th Grade
Discover more resources for Chemistry
22 questions
Unit 9 Gas Law Quiz
Quiz
•
10th Grade
20 questions
Types of Chemical Reactions
Quiz
•
9th - 12th Grade
13 questions
Solubility Curves
Quiz
•
10th Grade
20 questions
momentum and impulse
Quiz
•
9th - 12th Grade
22 questions
Solubility Curve Practice
Quiz
•
10th Grade
40 questions
Unit 3 (Part 1) Chemical Equations & Reactions Review Game
Quiz
•
8th - 12th Grade
35 questions
Types of Chemical Reactions
Quiz
•
9th - 12th Grade
15 questions
Ionic Bonding
Quiz
•
10th - 11th Grade