Statistical Analysis Concepts
Interactive Video
•
Biology, Science, Mathematics
•
10th - 12th Grade
•
Practice Problem
•
Hard

Patricia Brown
FREE Resource
Read more
10 questions
Show all answers
1.
MULTIPLE CHOICE QUESTION
30 sec • 1 pt
What do histograms primarily show in data analysis?
The mean of the data
The distribution of data
The median of the data
The mode of the data
2.
MULTIPLE CHOICE QUESTION
30 sec • 1 pt
Which test is used to compare two values in statistics?
ANOVA
Regression analysis
T-test
Chi-square test
3.
MULTIPLE CHOICE QUESTION
30 sec • 1 pt
In a chi-square test, what type of data is preferred?
Averages
Real numbers
Percentages
Ratios
4.
MULTIPLE CHOICE QUESTION
30 sec • 1 pt
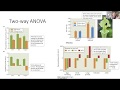
What does ANOVA help to compare in statistical analysis?
Two categorical variables
Means among more than two categorical variables
The correlation between two variables
The distribution of a single variable
5.
MULTIPLE CHOICE QUESTION
30 sec • 1 pt
Which of the following is NOT a categorical variable example mentioned in the transcript?
Brown trout
Photosynthetic rate
High pesticide
Lizards absent
6.
MULTIPLE CHOICE QUESTION
30 sec • 1 pt
What is the purpose of regression analyses in data interpretation?
To show data distribution
To compare means
To test hypotheses
To understand patterns and relationships
7.
MULTIPLE CHOICE QUESTION
30 sec • 1 pt
What does a slope of zero in a regression analysis indicate?
A positive relationship
A negative relationship
A strong correlation
No relationship
Access all questions and much more by creating a free account
Create resources
Host any resource
Get auto-graded reports
Continue with Google

Continue with Email
Continue with Microsoft
or continue with

%20(1).png)
Apple
Others
Already have an account?
