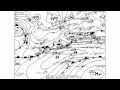
Weather Systems and Surface Maps
Interactive Video
•
Science, Geography, Other
•
9th - 12th Grade
•
Practice Problem
•
Hard

Patricia Brown
FREE Resource
Read more
10 questions
Show all answers
1.
MULTIPLE CHOICE QUESTION
30 sec • 1 pt
What is the date and time of the surface map being analyzed in the screencast?
November 14th, 2011 at 11:00 Alaska Standard Time
November 15th, 2011 at 18:00 Universal Time
November 15th, 2011 at 11:00 Alaska Standard Time
November 14th, 2011 at 18:00 Universal Time
2.
MULTIPLE CHOICE QUESTION
30 sec • 1 pt
What does a quarter-shaded circle in the surface observations indicate?
The sky is one quarter covered with clouds
The sky is clear
The sky is half covered with clouds
The sky is completely covered with clouds
3.
MULTIPLE CHOICE QUESTION
30 sec • 1 pt
What does a plus sign next to the cloud cover symbol indicate?
The pressure is lower than it was 3 hours ago
The pressure is higher than it was 3 hours ago
The temperature is higher than it was 3 hours ago
The temperature is lower than it was 3 hours ago
4.
MULTIPLE CHOICE QUESTION
30 sec • 1 pt
What is the barometric pressure at the time of observation if the number above the nine is 134?
1013.4 mbar
13.4 mbar
1034.0 mbar
134.0 mbar
5.
MULTIPLE CHOICE QUESTION
30 sec • 1 pt
What does the wind symbol indicate in the sea observation?
Winds are out of the Northeast at 15 to 20 miles per hour
Winds are out of the Southwest at 15 to 20 miles per hour
Winds are out of the Southeast at 15 to 20 miles per hour
Winds are calm
6.
MULTIPLE CHOICE QUESTION
30 sec • 1 pt
What do isobaric lines on a surface map represent?
Lines of constant pressure
Lines of constant humidity
Lines of constant temperature
Lines of constant wind speed
7.
MULTIPLE CHOICE QUESTION
30 sec • 1 pt
What is the central pressure of the high pressure system mentioned in the screencast?
998 mbar
1000 mbar
1026 mbar
1013 mbar
Access all questions and much more by creating a free account
Create resources
Host any resource
Get auto-graded reports
Continue with Google

Continue with Email
Continue with Classlink
Continue with Clever
or continue with
Microsoft
%20(1).png)
Apple
Others
Already have an account?
Popular Resources on Wayground

15 questions
Fractions on a Number Line
Quiz
•
3rd Grade
10 questions
Probability Practice
Quiz
•
4th Grade
15 questions
Probability on Number LIne
Quiz
•
4th Grade
20 questions
Equivalent Fractions
Quiz
•
3rd Grade
25 questions
Multiplication Facts
Quiz
•
5th Grade
22 questions
fractions
Quiz
•
3rd Grade
6 questions
Appropriate Chromebook Usage
Lesson
•
7th Grade
10 questions
Greek Bases tele and phon
Quiz
•
6th - 8th Grade
Discover more resources for Science
25 questions
Naming Ionic and Covalent Compounds
Quiz
•
9th Grade
10 questions
Exploring Weathering, Erosion, and Deposition Processes
Interactive video
•
6th - 10th Grade
26 questions
Unit 8b Review
Quiz
•
9th Grade
14 questions
Natural Selection and Adaptation
Lesson
•
9th - 12th Grade
10 questions
Exploring Water Pollution and Conservation
Interactive video
•
6th - 10th Grade
10 questions
Exploring the Human Respiratory System
Interactive video
•
6th - 10th Grade
30 questions
Unit 2C Progress Check (Biosphere 3)
Quiz
•
9th - 12th Grade
14 questions
Genetics Practice (Mendelian & Non-mendelian)
Quiz
•
10th Grade