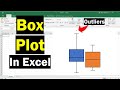
Box Plot Analysis in Excel
Interactive Video
•
Mathematics, Computers, Science
•
9th - 12th Grade
•
Practice Problem
•
Hard

Patricia Brown
FREE Resource
Read more
10 questions
Show all answers
1.
MULTIPLE CHOICE QUESTION
30 sec • 1 pt
What is the primary software used in this tutorial to create a box plot?
LibreOffice Calc
Microsoft Excel
Google Sheets
Apple Numbers
2.
MULTIPLE CHOICE QUESTION
30 sec • 1 pt
Which Excel function is used to calculate the minimum value in a data set?
AVERAGE
MAX
MIN
SUM
3.
MULTIPLE CHOICE QUESTION
30 sec • 1 pt
What does the line within the box of a box plot represent?
Median
Mode
Mean
Range
4.
MULTIPLE CHOICE QUESTION
30 sec • 1 pt
How is the interquartile range calculated in a box plot?
Difference between third and first quartiles
Sum of first and third quartiles
Average of all data points
Difference between maximum and minimum values
5.
MULTIPLE CHOICE QUESTION
30 sec • 1 pt
What symbol does Excel use to mark the mean value on a box plot by default?
Square
Triangle
X
Circle
6.
MULTIPLE CHOICE QUESTION
30 sec • 1 pt
What is the threshold multiplier used to determine outliers in a box plot?
2.0
1.5
1.0
2.5
7.
MULTIPLE CHOICE QUESTION
30 sec • 1 pt
How can you remove outlier points from a box plot in Excel?
Use a different Excel version
Change the chart type
Uncheck the 'Show Outlier Points' option
Delete the data points
Access all questions and much more by creating a free account
Create resources
Host any resource
Get auto-graded reports
Continue with Google

Continue with Email
Continue with Classlink
Continue with Clever
or continue with
Microsoft
%20(1).png)
Apple
Others
Already have an account?
Similar Resources on Wayground
Popular Resources on Wayground

15 questions
Fractions on a Number Line
Quiz
•
3rd Grade
20 questions
Equivalent Fractions
Quiz
•
3rd Grade
25 questions
Multiplication Facts
Quiz
•
5th Grade
54 questions
Analyzing Line Graphs & Tables
Quiz
•
4th Grade
22 questions
fractions
Quiz
•
3rd Grade
20 questions
Main Idea and Details
Quiz
•
5th Grade
20 questions
Context Clues
Quiz
•
6th Grade
15 questions
Equivalent Fractions
Quiz
•
4th Grade
Discover more resources for Mathematics
20 questions
Graphing Inequalities on a Number Line
Quiz
•
6th - 9th Grade
18 questions
SAT Prep: Ratios, Proportions, & Percents
Quiz
•
9th - 10th Grade
12 questions
Exponential Growth and Decay
Quiz
•
9th Grade
12 questions
Parallel Lines Cut by a Transversal
Quiz
•
10th Grade
12 questions
Add and Subtract Polynomials
Quiz
•
9th - 12th Grade
15 questions
Combine Like Terms and Distributive Property
Quiz
•
8th - 9th Grade
20 questions
Function or Not a Function
Quiz
•
8th - 9th Grade
10 questions
Elijah McCoy: Innovations and Impact in Black History
Interactive video
•
6th - 10th Grade