Statistics: Box Plots and Outliers
Interactive Video
•
Mathematics, Science, Other
•
6th - 8th Grade
•
Practice Problem
•
Hard

Patricia Brown
FREE Resource
Read more
10 questions
Show all answers
1.
MULTIPLE CHOICE QUESTION
30 sec • 1 pt
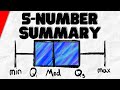
What are the components of a five number summary?
Minimum, median, and maximum
Minimum, maximum, and interquartile range
First quartile, median, and third quartile
Minimum, first quartile, median, third quartile, and maximum
2.
MULTIPLE CHOICE QUESTION
30 sec • 1 pt
How do you find the median in an even data set?
By selecting the first number
By averaging the two middle numbers
By choosing the largest number
By choosing the smallest number
3.
MULTIPLE CHOICE QUESTION
30 sec • 1 pt
What is the first step in finding the five number summary?
Drawing a box plot
Ordering the data from least to greatest
Calculating the interquartile range
Identifying outliers
4.
MULTIPLE CHOICE QUESTION
30 sec • 1 pt
What does the box in a box plot represent?
The range of the data
The interquartile range
The median
The outliers
5.
MULTIPLE CHOICE QUESTION
30 sec • 1 pt
How is the interquartile range (IQR) calculated?
Maximum minus minimum
Q1 plus Q3
Median minus Q1
Q3 minus Q1
6.
MULTIPLE CHOICE QUESTION
30 sec • 1 pt
What is the purpose of the whiskers in a box plot?
To show the interquartile range
To highlight outliers
To extend to the minimum and maximum values
To indicate the median
7.
MULTIPLE CHOICE QUESTION
30 sec • 1 pt
How can you identify an outlier using the IQR?
If it is the maximum value
If it is within the interquartile range
If it is equal to the median
If it is less than Q1 minus 1.5 times the IQR or greater than Q3 plus 1.5 times the IQR
Access all questions and much more by creating a free account
Create resources
Host any resource
Get auto-graded reports
Continue with Google

Continue with Email
Continue with Classlink
Continue with Clever
or continue with
Microsoft
%20(1).png)
Apple
Others
Already have an account?
Popular Resources on Wayground

15 questions
Fractions on a Number Line
Quiz
•
3rd Grade
20 questions
Equivalent Fractions
Quiz
•
3rd Grade
25 questions
Multiplication Facts
Quiz
•
5th Grade
22 questions
fractions
Quiz
•
3rd Grade
20 questions
Main Idea and Details
Quiz
•
5th Grade
20 questions
Context Clues
Quiz
•
6th Grade
15 questions
Equivalent Fractions
Quiz
•
4th Grade
20 questions
Figurative Language Review
Quiz
•
6th Grade
Discover more resources for Mathematics
20 questions
Exponents
Quiz
•
6th Grade
22 questions
distributive property
Quiz
•
7th Grade
15 questions
Distributive Property & Review
Quiz
•
6th Grade
20 questions
Writing Algebraic Expressions
Quiz
•
6th Grade
20 questions
Ratios/Rates and Unit Rates
Quiz
•
6th Grade
20 questions
Writing and Graphing Inequalities
Quiz
•
6th Grade
15 questions
Product of Powers Property A1 U7
Quiz
•
8th Grade
20 questions
Laws of Exponents
Quiz
•
8th Grade