Understanding Data Representation and Analysis
Interactive Video
•
Mathematics, Science, Other
•
1st - 3rd Grade
•
Practice Problem
•
Hard

Patricia Brown
FREE Resource
Read more
10 questions
Show all answers
1.
MULTIPLE CHOICE QUESTION
30 sec • 1 pt
What is data primarily used for?
To decorate a room
To cook a meal
To provide information about things
To create music
2.
MULTIPLE CHOICE QUESTION
30 sec • 1 pt
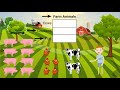
How many types of animals are on the farm?
Three
Two
Four
Five
3.
MULTIPLE CHOICE QUESTION
30 sec • 1 pt
What is another name for a picture graph?
Histogram
Line graph
Pictograph
Pie chart
4.
MULTIPLE CHOICE QUESTION
30 sec • 1 pt
How many chickens are there on the farm?
Two
Five
Eight
Ten
5.
MULTIPLE CHOICE QUESTION
30 sec • 1 pt
What does a tally chart use to represent data?
Bars
Numbers
Pictures
Line marks
6.
MULTIPLE CHOICE QUESTION
30 sec • 1 pt
How is the fifth mark represented in a tally chart?
With a circle
With a diagonal line
With a star
With a square
7.
MULTIPLE CHOICE QUESTION
30 sec • 1 pt
What does a bar graph use to show data?
Dots
Bars
Triangles
Lines
Access all questions and much more by creating a free account
Create resources
Host any resource
Get auto-graded reports
Continue with Google

Continue with Email
Continue with Classlink
Continue with Clever
or continue with
Microsoft
%20(1).png)
Apple
Others
Already have an account?
