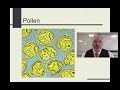
Pollen Diagrams and Vegetation History
Interactive Video
•
Biology, Science, Geography
•
9th - 10th Grade
•
Practice Problem
•
Hard

Patricia Brown
FREE Resource
Read more
10 questions
Show all answers
1.
MULTIPLE CHOICE QUESTION
30 sec • 1 pt
What is the primary purpose of pollen diagrams in studying vegetation history?
To measure the amount of rainfall in ancient times
To identify the age of rocks
To determine the types of vegetation that existed in the past
To track animal migration patterns
2.
MULTIPLE CHOICE QUESTION
30 sec • 1 pt
Which factor is most responsible for the destruction of pollen?
Oxygen
Heat
Sunlight
Water
3.
MULTIPLE CHOICE QUESTION
30 sec • 1 pt
Why is pollen considered a robust indicator of past vegetation?
It is only found in specific regions
It is large and easy to find
It is resistant to decay in anaerobic conditions
It changes color over time
4.
MULTIPLE CHOICE QUESTION
30 sec • 1 pt
What tool is used to extract sediment cores for pollen analysis?
A Russian corer
A sediment sieve
A drilling rig
A soil auger
5.
MULTIPLE CHOICE QUESTION
30 sec • 1 pt
How many pollen grains are typically counted to get a reliable picture of past vegetation?
50-100
100-200
300-500
600-800
6.
MULTIPLE CHOICE QUESTION
30 sec • 1 pt
What does a pollen diagram represent?
The migration patterns of animals
The temperature changes over centuries
The percentage of different pollen species over time
The growth rate of plants
7.
MULTIPLE CHOICE QUESTION
30 sec • 1 pt
What is a pollen zone?
A horizontal line dividing periods of different vegetation communities
A vertical line on a pollen diagram
A region with high pollen concentration
A type of pollen grain
Access all questions and much more by creating a free account
Create resources
Host any resource
Get auto-graded reports
Continue with Google

Continue with Email
Continue with Classlink
Continue with Clever
or continue with
Microsoft
%20(1).png)
Apple
Others
Already have an account?
