Weather Data Analysis and Interpretation
Interactive Video
•
Science, Mathematics, Biology
•
3rd - 4th Grade
•
Practice Problem
•
Hard

Patricia Brown
FREE Resource
Read more
10 questions
Show all answers
1.
MULTIPLE CHOICE QUESTION
30 sec • 1 pt
What was the main conclusion about Blue Island in Chapter 1?
It had the least amount of rain.
It had the best combination of rain and heat.
It had the most diverse wildlife.
It was the largest island.
2.
MULTIPLE CHOICE QUESTION
30 sec • 1 pt
Which island had the highest temperature on day two?
Blue Island
Arc Island
Creek Island
None of the above
3.
MULTIPLE CHOICE QUESTION
30 sec • 1 pt
Why is two days of weather data not enough to make a confident decision about the islands?
Because the data is too similar.
Because the data is too complex.
Because the data is inaccurate.
Because more data is needed to identify patterns.
4.
MULTIPLE CHOICE QUESTION
30 sec • 1 pt
What is the purpose of using graphs in weather analysis?
To confuse the viewers.
To make the data look more colorful.
To organize data and identify patterns.
To reduce the amount of data.
5.
MULTIPLE CHOICE QUESTION
30 sec • 1 pt
What type of graph is primarily used to organize weather data in this lesson?
Scatter plot
Line plot
Pie chart
Bar graph
6.
MULTIPLE CHOICE QUESTION
30 sec • 1 pt
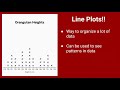
What is the range of heights for female orangutans according to the line plot?
100 to 110 centimeters
130 to 140 centimeters
125 to 132 centimeters
120 to 126 centimeters
7.
MULTIPLE CHOICE QUESTION
30 sec • 1 pt
How do meteorologists compare rainfall across different locations?
By observing cloud patterns.
By adding up precipitation values.
By measuring the temperature.
By counting the number of rainy days.
Access all questions and much more by creating a free account
Create resources
Host any resource
Get auto-graded reports
Continue with Google

Continue with Email
Continue with Microsoft
or continue with

%20(1).png)
Apple
Others
Already have an account?
