Weather Data Analysis and Comparisons
Interactive Video
•
Science, Mathematics, Biology
•
3rd - 5th Grade
•
Practice Problem
•
Hard

Patricia Brown
FREE Resource
Read more
10 questions
Show all answers
1.
MULTIPLE CHOICE QUESTION
30 sec • 1 pt
What was the main conclusion about Blue Island in Chapter 1?
It had the most trees.
It had the best combination of rain and heat.
It was the largest island.
It had the most animals.
2.
MULTIPLE CHOICE QUESTION
30 sec • 1 pt
On day two, which island had the highest temperature?
None of the above
Creek Island
Blue Island
Arc Island
3.
MULTIPLE CHOICE QUESTION
30 sec • 1 pt
Why is two days of weather data not enough to make a confident decision about the best island?
Because the islands are too far apart.
Because the data is too similar.
Because the temperatures are too high.
Because two days is not enough to establish a pattern.
4.
MULTIPLE CHOICE QUESTION
30 sec • 1 pt
What tool did the teacher introduce to help analyze large amounts of data?
Maps
Graphs
Tables
Diagrams
5.
MULTIPLE CHOICE QUESTION
30 sec • 1 pt
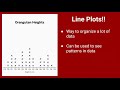
What is a line plot used for?
To draw pictures
To organize and see patterns in data
To create a list of items
To write stories
6.
MULTIPLE CHOICE QUESTION
30 sec • 1 pt
What is the range of heights for female orangutans according to the line plot?
120 to 126 centimeters
125 to 132 centimeters
130 to 140 centimeters
100 to 110 centimeters
7.
MULTIPLE CHOICE QUESTION
30 sec • 1 pt
How do meteorologists compare rainfall for different locations?
By checking the temperature
By counting the number of rainy days
By adding up the total precipitation for each month
By measuring the wind speed
Access all questions and much more by creating a free account
Create resources
Host any resource
Get auto-graded reports
Continue with Google

Continue with Email
Continue with Classlink
Continue with Clever
or continue with
Microsoft
%20(1).png)
Apple
Others
Already have an account?
Similar Resources on Wayground
Popular Resources on Wayground

15 questions
Fractions on a Number Line
Quiz
•
3rd Grade
10 questions
Probability Practice
Quiz
•
4th Grade
15 questions
Probability on Number LIne
Quiz
•
4th Grade
20 questions
Equivalent Fractions
Quiz
•
3rd Grade
25 questions
Multiplication Facts
Quiz
•
5th Grade
22 questions
fractions
Quiz
•
3rd Grade
6 questions
Appropriate Chromebook Usage
Lesson
•
7th Grade
10 questions
Greek Bases tele and phon
Quiz
•
6th - 8th Grade
Discover more resources for Science
15 questions
Earthly Ecosystems Unit Review
Quiz
•
3rd Grade
20 questions
Weathering, Erosion, Deposition
Quiz
•
5th Grade
22 questions
Ancient Greece
Quiz
•
3rd Grade
15 questions
Physical and Chemical Changes
Quiz
•
4th Grade
20 questions
Food Chains and Food Webs Review
Quiz
•
5th Grade
28 questions
4th Grade The Need for Speed
Quiz
•
3rd - 5th Grade
20 questions
The Water Cycle
Quiz
•
4th - 5th Grade
20 questions
Food Webs
Quiz
•
5th Grade