Latitude and Climate Effects
Interactive Video
•
Science, Geography, Other
•
6th - 8th Grade
•
Practice Problem
•
Hard

Patricia Brown
FREE Resource
Read more
10 questions
Show all answers
1.
MULTIPLE CHOICE QUESTION
30 sec • 1 pt
What is the primary focus of the warm-up activity in the lesson?
Understanding the water cycle
Analyzing why Christchurch is cooler during El Niño
Studying the effects of global warming
Learning about ocean currents
2.
MULTIPLE CHOICE QUESTION
30 sec • 1 pt
Which factor is emphasized as influencing temperature differences between locations?
Amount of rainfall
Proximity to mountains
Wind patterns
Latitude and solar energy
3.
MULTIPLE CHOICE QUESTION
30 sec • 1 pt
How does latitude primarily affect the temperature of a location?
By influencing the type of vegetation
By controlling the wind speed
By determining the amount of rainfall
By affecting the amount of solar energy received
4.
MULTIPLE CHOICE QUESTION
30 sec • 1 pt
What is the main claim about Christchurch's temperature during El Niño years?
It is warmer due to increased solar energy
It is cooler due to changes in ocean surface temperature
It is affected by increased rainfall
It remains the same as in normal years
5.
MULTIPLE CHOICE QUESTION
30 sec • 1 pt
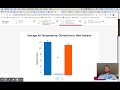
What does the graph analysis reveal about the solar energy received by Christchurch during El Niño years?
It increases significantly
It decreases significantly
It fluctuates randomly
It remains unchanged
6.
MULTIPLE CHOICE QUESTION
30 sec • 1 pt
Which claim is supported by the graph analysis regarding ocean surface temperatures?
Ocean temperatures increase during El Niño
Ocean temperatures remain constant
Ocean temperatures are unpredictable
Ocean temperatures decrease during El Niño
7.
MULTIPLE CHOICE QUESTION
30 sec • 1 pt
What is the purpose of the self-assessment homework?
To review the water cycle
To assess knowledge of ocean currents
To evaluate understanding of El Niño effects
To test knowledge on global warming
Access all questions and much more by creating a free account
Create resources
Host any resource
Get auto-graded reports
Continue with Google

Continue with Email
Continue with Classlink
Continue with Clever
or continue with
Microsoft
%20(1).png)
Apple
Others
Already have an account?
Popular Resources on Wayground

8 questions
Spartan Way - Classroom Responsible
Quiz
•
9th - 12th Grade
15 questions
Fractions on a Number Line
Quiz
•
3rd Grade
14 questions
Boundaries & Healthy Relationships
Lesson
•
6th - 8th Grade
20 questions
Equivalent Fractions
Quiz
•
3rd Grade
3 questions
Integrity and Your Health
Lesson
•
6th - 8th Grade
25 questions
Multiplication Facts
Quiz
•
5th Grade
9 questions
FOREST Perception
Lesson
•
KG
20 questions
Main Idea and Details
Quiz
•
5th Grade
Discover more resources for Science
22 questions
Phases of the moon
Quiz
•
8th Grade
20 questions
Rocks and The Rock Cycle
Quiz
•
6th Grade
20 questions
Flow of Energy
Quiz
•
7th Grade
20 questions
Waves and Wave Properties
Quiz
•
6th - 8th Grade
8 questions
Amoeba Sister Asexual vs Sexual Reproduction
Interactive video
•
8th Grade
10 questions
Exploring the Rock Cycle: Types and Formation
Interactive video
•
6th - 8th Grade
16 questions
Photosynthesis and Cellular Respiration Review
Quiz
•
7th Grade
20 questions
8th Grade Science STAAR Review
Quiz
•
8th Grade