Linear Relationships and Data Interpretation
Interactive Video
•
Mathematics, Science, Other
•
7th - 8th Grade
•
Practice Problem
•
Hard

Thomas White
FREE Resource
Read more
10 questions
Show all answers
1.
MULTIPLE CHOICE QUESTION
30 sec • 1 pt
What is the primary purpose of scatter plots in statistics?
To organize data alphabetically
To display data in a tabular format
To show the relationship between two variables
To calculate the mean of a dataset
2.
MULTIPLE CHOICE QUESTION
30 sec • 1 pt
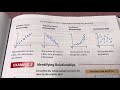
Which of the following best describes a positive linear relationship?
Data points rise from left to right
Data points fall from left to right
Data points are scattered randomly
Data points form a curve
3.
MULTIPLE CHOICE QUESTION
30 sec • 1 pt
In a positive linear relationship, what happens to the value of y as x increases?
y remains constant
y increases
y decreases
y becomes zero
4.
MULTIPLE CHOICE QUESTION
30 sec • 1 pt
What characterizes a negative linear relationship?
Data points form a horizontal line
Data points form a vertical line
Data points rise from left to right
Data points fall from left to right
5.
MULTIPLE CHOICE QUESTION
30 sec • 1 pt
In a negative linear relationship, what happens to y as x increases?
y increases
y decreases
y remains constant
y becomes zero
6.
MULTIPLE CHOICE QUESTION
30 sec • 1 pt
What is a key feature of a non-linear relationship?
Data points are scattered randomly
Data points form a straight line
Data points form a zigzag pattern
Data points form a curve
7.
MULTIPLE CHOICE QUESTION
30 sec • 1 pt
Which term is often used to describe a non-linear relationship?
Horizontal
Curvilinear
Linear
Random
Access all questions and much more by creating a free account
Create resources
Host any resource
Get auto-graded reports
Continue with Google

Continue with Email
Continue with Classlink
Continue with Clever
or continue with
Microsoft
%20(1).png)
Apple
Others
Already have an account?
Similar Resources on Wayground

10 questions
Post Career Research Motivation Video
Interactive video
•
8th Grade
8 questions
Median, Mean, Mode, and Range
Interactive video
•
6th - 7th Grade
11 questions
Crafting the Experimental Design FRQ for AP Environmental Science
Interactive video
•
6th - 10th Grade
11 questions
Brenton's Leaf Man Video Adventure
Interactive video
•
6th - 7th Grade
Popular Resources on Wayground
15 questions
Fractions on a Number Line
Quiz
•
3rd Grade
20 questions
Equivalent Fractions
Quiz
•
3rd Grade
25 questions
Multiplication Facts
Quiz
•
5th Grade
54 questions
Analyzing Line Graphs & Tables
Quiz
•
4th Grade
22 questions
fractions
Quiz
•
3rd Grade
20 questions
Main Idea and Details
Quiz
•
5th Grade
20 questions
Context Clues
Quiz
•
6th Grade
15 questions
Equivalent Fractions
Quiz
•
4th Grade
Discover more resources for Mathematics
22 questions
distributive property
Quiz
•
7th Grade
18 questions
Angle Relationships
Quiz
•
7th Grade
20 questions
How Some Friendships Last — and Others Don’t Video Questions
Quiz
•
7th Grade
14 questions
finding slope from a graph
Quiz
•
8th Grade
18 questions
Handbook Refresher Quiz
Quiz
•
7th Grade
20 questions
Laws of Exponents
Quiz
•
8th Grade
12 questions
8th U5L9 Linear Models
Quiz
•
8th Grade
20 questions
Graphing Inequalities on a Number Line
Quiz
•
6th - 9th Grade