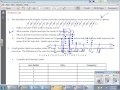
Understanding Frequency Tables and Dot Plots
Interactive Video
•
Mathematics, Science, Other
•
6th - 8th Grade
•
Practice Problem
•
Hard

Thomas White
FREE Resource
Read more
10 questions
Show all answers
1.
MULTIPLE CHOICE QUESTION
30 sec • 1 pt
What is the primary focus of today's math lesson?
Learning about algebraic equations
Understanding dot plots and frequency tables
Exploring geometric shapes
Creating bar graphs and pie charts
2.
MULTIPLE CHOICE QUESTION
30 sec • 1 pt
When creating a dot plot, why is it suggested to start with an interval lower than the smallest value?
To confuse the viewers
To make the plot look more colorful
To ensure all data points are included
To clean up the plot and make it more organized
3.
MULTIPLE CHOICE QUESTION
30 sec • 1 pt
What interval was ultimately chosen for the dot plot in the lesson?
Interval of 1
Interval of 5
Interval of 2
Interval of 3
4.
MULTIPLE CHOICE QUESTION
30 sec • 1 pt
In the dot plot, which number of goals was identified as the most common?
8
16
11
13
5.
MULTIPLE CHOICE QUESTION
30 sec • 1 pt
What is the purpose of using tally marks in a frequency table?
To add more numbers to the table
To confuse the reader
To easily count and group data
To make the table look artistic
6.
MULTIPLE CHOICE QUESTION
30 sec • 1 pt
What is the range of possibilities when rolling two number cubes?
4 to 18
1 to 10
2 to 12
3 to 15
7.
MULTIPLE CHOICE QUESTION
30 sec • 1 pt
How many times were the number cubes rolled in the frequency table example?
15 times
18 times
21 times
25 times
Access all questions and much more by creating a free account
Create resources
Host any resource
Get auto-graded reports
Continue with Google

Continue with Email
Continue with Microsoft
or continue with

%20(1).png)
Apple
Others
Already have an account?
