Proportional Relationships and Graphing
Interactive Video
•
Mathematics
•
6th - 7th Grade
•
Practice Problem
•
Hard

Thomas White
FREE Resource
Read more
10 questions
Show all answers
1.
MULTIPLE CHOICE QUESTION
30 sec • 1 pt
What is the main focus of lesson 15?
Understanding fractions
Learning about algebraic expressions
Exploring ratios and proportional relationships
Studying geometric shapes
2.
MULTIPLE CHOICE QUESTION
30 sec • 1 pt
What are students responsible for at the Junior Beta Club induction reception?
Invitations
Providing snacks and drinks
Music
Decorations
3.
MULTIPLE CHOICE QUESTION
30 sec • 1 pt
How do Susan and Myra determine the proportion of cranberry juice to sparkling water?
Using a recipe book
Asking a teacher
Using a chart
By guessing
4.
MULTIPLE CHOICE QUESTION
30 sec • 1 pt
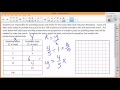
What is the first step in completing the chart and graphing the data?
Mixing the ingredients
Calculating the total amount of punch
Drawing the graph
Finding the constant of proportionality
5.
MULTIPLE CHOICE QUESTION
30 sec • 1 pt
How is the constant of proportionality found?
By dividing the y value by the x value
By subtracting the x value from the y value
By adding the x and y values
By multiplying the x and y values
6.
MULTIPLE CHOICE QUESTION
30 sec • 1 pt
What is the equation of the proportional relationship in this lesson?
y = x + 4/5
y = 5/4x
y = x - 4/5
y = 4/5x
7.
MULTIPLE CHOICE QUESTION
30 sec • 1 pt
How do you calculate the y value in the chart?
Divide the x value by 4/5
Subtract 4/5 from the x value
Add 4/5 to the x value
Multiply the x value by 4/5
Access all questions and much more by creating a free account
Create resources
Host any resource
Get auto-graded reports
Continue with Google

Continue with Email
Continue with Classlink
Continue with Clever
or continue with
Microsoft
%20(1).png)
Apple
Others
Already have an account?
