Understanding Linear Functions and Trends
Interactive Video
•
Mathematics, Biology, Science
•
9th - 10th Grade
•
Practice Problem
•
Hard

Thomas White
FREE Resource
Read more
10 questions
Show all answers
1.
MULTIPLE CHOICE QUESTION
30 sec • 1 pt
What is the primary focus of the lesson on linear functions?
Understanding quadratic equations
Exploring the relationship between body mass and bite force
Learning about geometric shapes
Studying the lifecycle of crocodiles
2.
MULTIPLE CHOICE QUESTION
30 sec • 1 pt
What is the unit of measurement used for bite force in the lesson?
Joules
Newtons
Kilograms
Pounds per square inch
3.
MULTIPLE CHOICE QUESTION
30 sec • 1 pt
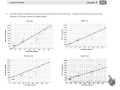
What is the trend observed in the scatter plot regarding body mass and bite force?
There is no observable trend
As body mass increases, bite force remains constant
As body mass increases, bite force decreases
As body mass increases, bite force increases
4.
MULTIPLE CHOICE QUESTION
30 sec • 1 pt
What is the purpose of drawing a line on a scatter plot?
To connect all data points
To represent the trend in the data
To highlight outliers
To separate different data sets
5.
MULTIPLE CHOICE QUESTION
30 sec • 1 pt
Which student's line was considered a good fit for the data?
Marissa
Patti
Taylor
Saul
6.
MULTIPLE CHOICE QUESTION
30 sec • 1 pt
What is the first step in finding the equation of a line using two points?
Calculate the y-intercept
Determine the slope
Draw a perpendicular line
Find the midpoint
7.
MULTIPLE CHOICE QUESTION
30 sec • 1 pt
What does a negative slope indicate in the context of used car prices?
The car's price fluctuates randomly
The car's price remains constant
The car's price decreases with age
The car's price increases with age
Access all questions and much more by creating a free account
Create resources
Host any resource
Get auto-graded reports
Continue with Google

Continue with Email
Continue with Classlink
Continue with Clever
or continue with
Microsoft
%20(1).png)
Apple
Others
Already have an account?
Popular Resources on Wayground

15 questions
Fractions on a Number Line
Quiz
•
3rd Grade
20 questions
Equivalent Fractions
Quiz
•
3rd Grade
25 questions
Multiplication Facts
Quiz
•
5th Grade
29 questions
Alg. 1 Section 5.1 Coordinate Plane
Quiz
•
9th Grade
22 questions
fractions
Quiz
•
3rd Grade
11 questions
FOREST Effective communication
Lesson
•
KG
20 questions
Main Idea and Details
Quiz
•
5th Grade
20 questions
Context Clues
Quiz
•
6th Grade
Discover more resources for Mathematics
29 questions
Alg. 1 Section 5.1 Coordinate Plane
Quiz
•
9th Grade
20 questions
Graphing Inequalities on a Number Line
Quiz
•
6th - 9th Grade
20 questions
Box and Whisker Plots
Quiz
•
9th Grade
18 questions
Exponential Growth and Decay
Quiz
•
9th Grade
20 questions
Function or Not a Function
Quiz
•
8th - 9th Grade
20 questions
SSS/SAS
Quiz
•
9th - 12th Grade
14 questions
Making Inferences From Samples
Quiz
•
7th - 12th Grade
23 questions
CCG - CH8 Polygon angles and area Review
Quiz
•
9th - 12th Grade