Linear Models and Their Interpretations
Interactive Video
•
Mathematics, Science, Other
•
9th - 12th Grade
•
Practice Problem
•
Hard

Thomas White
FREE Resource
Read more
10 questions
Show all answers
1.
MULTIPLE CHOICE QUESTION
30 sec • 1 pt
What is the primary focus of Lesson 11 in Module 6?
Using quadratic models in a data context
Using linear models in a data context
Learning about statistical distributions
Understanding geometric shapes
2.
MULTIPLE CHOICE QUESTION
30 sec • 1 pt
In the Old Faithful example, which variable is considered dependent?
Amount of water
Length of eruption
Height of eruption
Temperature of water
3.
MULTIPLE CHOICE QUESTION
30 sec • 1 pt
What does the slope of the linear model for Old Faithful represent?
Gallons per hour
Gallons per eruption
Gallons per minute
Minutes per gallon
4.
MULTIPLE CHOICE QUESTION
30 sec • 1 pt
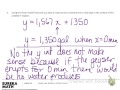
In the context of the Old Faithful model, why does the y-intercept not make sense?
It predicts negative water output
It predicts infinite water output
It predicts water when there is no eruption
It predicts zero water output
5.
MULTIPLE CHOICE QUESTION
30 sec • 1 pt
What is the dependent variable in the Olympic 100-meter race example?
Mean medal time
Location of the Olympics
Number of participants
Year
6.
MULTIPLE CHOICE QUESTION
30 sec • 1 pt
What trend is observed in the Olympic 100-meter race times over the years?
Times are increasing
Times fluctuate randomly
Times are decreasing
Times remain constant
7.
MULTIPLE CHOICE QUESTION
30 sec • 1 pt
How is the slope of the line in the Olympic race data interpreted?
Seconds per meter
Meters per second
Years per second
Seconds per year
Access all questions and much more by creating a free account
Create resources
Host any resource
Get auto-graded reports
Continue with Google

Continue with Email
Continue with Classlink
Continue with Clever
or continue with
Microsoft
%20(1).png)
Apple
Others
Already have an account?
Popular Resources on Wayground

7 questions
History of Valentine's Day
Interactive video
•
4th Grade
15 questions
Fractions on a Number Line
Quiz
•
3rd Grade
20 questions
Equivalent Fractions
Quiz
•
3rd Grade
25 questions
Multiplication Facts
Quiz
•
5th Grade
22 questions
fractions
Quiz
•
3rd Grade
15 questions
Valentine's Day Trivia
Quiz
•
3rd Grade
20 questions
Main Idea and Details
Quiz
•
5th Grade
20 questions
Context Clues
Quiz
•
6th Grade
Discover more resources for Mathematics
20 questions
Graphing Inequalities on a Number Line
Quiz
•
6th - 9th Grade
20 questions
Exponent Properties
Quiz
•
9th Grade
15 questions
Combine Like Terms and Distributive Property
Quiz
•
8th - 9th Grade
20 questions
Function or Not a Function
Quiz
•
8th - 9th Grade
10 questions
Factor Quadratic Expressions with Various Coefficients
Quiz
•
9th - 12th Grade
10 questions
Elijah McCoy: Innovations and Impact in Black History
Interactive video
•
6th - 10th Grade
10 questions
Evaluating Piecewise Functions Practice
Quiz
•
11th Grade
21 questions
Factoring Trinomials (a=1)
Quiz
•
9th Grade