Identifying Linear Relationships and Functions
Interactive Video
•
Mathematics
•
6th - 8th Grade
•
Practice Problem
•
Hard

Thomas White
FREE Resource
Read more
10 questions
Show all answers
1.
MULTIPLE CHOICE QUESTION
30 sec • 1 pt
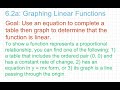
What is the primary goal of the lesson on graphing linear functions?
To solve complex algebraic equations
To learn about quadratic functions
To complete a table and graph to determine if a function is linear
To memorize equations
2.
MULTIPLE CHOICE QUESTION
30 sec • 1 pt
Which of the following is NOT a characteristic of a proportional relationship?
The table includes the ordered pair (0, 0)
The equation includes a constant term b
The equation is in the form y = mx
The graph passes through the origin
3.
MULTIPLE CHOICE QUESTION
30 sec • 1 pt
Which of the following is true about a linear relationship?
It is always proportional
It never passes through the origin
It can be represented by a vertical line
It is always a function except for vertical lines
4.
MULTIPLE CHOICE QUESTION
30 sec • 1 pt
How can you identify a non-proportional linear relationship from its equation?
The graph passes through the origin
The equation includes a constant term b
The equation is in the form y = mx
The table includes the ordered pair (0, 0)
5.
MULTIPLE CHOICE QUESTION
30 sec • 1 pt
What is the key difference between a proportional and a non-proportional linear relationship?
The presence of a constant term b in the equation
The slope of the line
The color of the graph
The number of points on the graph
6.
MULTIPLE CHOICE QUESTION
30 sec • 1 pt
In the rainfall example, what indicates that the relationship is proportional?
The graph does not pass through the origin
The equation includes a constant term b
The graph is a curve
The table includes the ordered pair (0, 0)
7.
MULTIPLE CHOICE QUESTION
30 sec • 1 pt
What is the rate of change in the rainfall example?
0.5 cm per hour
1.5 cm per hour
2.0 cm per hour
3.0 cm per hour
Access all questions and much more by creating a free account
Create resources
Host any resource
Get auto-graded reports
Continue with Google

Continue with Email
Continue with Classlink
Continue with Clever
or continue with
Microsoft
%20(1).png)
Apple
Others
Already have an account?
Popular Resources on Wayground

15 questions
Fractions on a Number Line
Quiz
•
3rd Grade
20 questions
Equivalent Fractions
Quiz
•
3rd Grade
25 questions
Multiplication Facts
Quiz
•
5th Grade
54 questions
Analyzing Line Graphs & Tables
Quiz
•
4th Grade
22 questions
fractions
Quiz
•
3rd Grade
20 questions
Main Idea and Details
Quiz
•
5th Grade
20 questions
Context Clues
Quiz
•
6th Grade
15 questions
Equivalent Fractions
Quiz
•
4th Grade
Discover more resources for Mathematics
22 questions
distributive property
Quiz
•
7th Grade
18 questions
Angle Relationships
Quiz
•
7th Grade
15 questions
Distributive Property & Review
Quiz
•
6th Grade
20 questions
Writing Algebraic Expressions
Quiz
•
6th Grade
20 questions
How Some Friendships Last — and Others Don’t Video Questions
Quiz
•
7th Grade
14 questions
finding slope from a graph
Quiz
•
8th Grade
20 questions
Ratios/Rates and Unit Rates
Quiz
•
6th Grade
18 questions
Handbook Refresher Quiz
Quiz
•
7th Grade