Understanding Linear Relationships and Functions
Interactive Video
•
Mathematics
•
6th - 7th Grade
•
Practice Problem
•
Hard

Thomas White
FREE Resource
Read more
10 questions
Show all answers
1.
MULTIPLE CHOICE QUESTION
30 sec • 1 pt
What does the term 'bivariant' refer to in the context of data?
Data with one variable
Data with no variables
Data with three variables
Data with two variables
2.
MULTIPLE CHOICE QUESTION
30 sec • 1 pt
How can you identify a linear set of data on a graph?
The data points form a triangle
The data points form a circle
The data points form a single line
The data points are scattered randomly
3.
MULTIPLE CHOICE QUESTION
30 sec • 1 pt
In the handrail example, what indicates that the relationship is linear?
The handrail changes color
The handrail height remains constant
The points fall on a straight line
The handrail is curved
4.
MULTIPLE CHOICE QUESTION
30 sec • 1 pt
What is the formula used to calculate the slope in a linear relationship?
m = y1 - y2 / x1 - x2
m = y2 - y1 / x2 - x1
m = x2 - x1 / y2 - y1
m = x1 - x2 / y1 - y2
5.
MULTIPLE CHOICE QUESTION
30 sec • 1 pt
Why is it important to correctly place the slope and intercept in the equation of a line?
To make the equation longer
To ensure the equation is colorful
To make the equation easier to read
To accurately represent the linear relationship
6.
MULTIPLE CHOICE QUESTION
30 sec • 1 pt
In the pizza toppings example, what is the y-intercept of the equation?
20
8
0
12
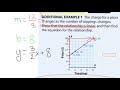
7.
MULTIPLE CHOICE QUESTION
30 sec • 1 pt
How do you determine the slope in the pizza toppings example?
By counting the number of toppings
By observing the color of the pizza
By calculating the rise over run
By measuring the diameter of the pizza
Access all questions and much more by creating a free account
Create resources
Host any resource
Get auto-graded reports
Continue with Google

Continue with Email
Continue with Classlink
Continue with Clever
or continue with
Microsoft
%20(1).png)
Apple
Others
Already have an account?
