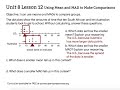
Mean Absolute Deviation and Travel Times
Interactive Video
•
Mathematics
•
6th - 7th Grade
•
Practice Problem
•
Hard

Thomas White
FREE Resource
Read more
10 questions
Show all answers
1.
MULTIPLE CHOICE QUESTION
30 sec • 1 pt
What is the primary purpose of using mean and MAD in data analysis?
To find the maximum value in a data set
To determine the median of a data set
To calculate the total sum of all data points
To compare groups by analyzing the center and spread of data
2.
MULTIPLE CHOICE QUESTION
30 sec • 1 pt
How is the mean of a data set best described?
The highest value in the data set
The middle value when data is ordered
The balance point or average of the data set
The difference between the largest and smallest values
3.
MULTIPLE CHOICE QUESTION
30 sec • 1 pt
In the context of the lesson, which group of students had a smaller mean travel time to school?
United States students
South African students
Australian students
Canadian students
4.
MULTIPLE CHOICE QUESTION
30 sec • 1 pt
What does the mean absolute deviation (MAD) indicate about a data set?
The sum of all data points
The highest value in the data set
The average distance of data points from the mean
The total number of data points
5.
MULTIPLE CHOICE QUESTION
30 sec • 1 pt
Which data set had a smaller MAD, indicating less spread in travel times?
United States students
Australian students
Canadian students
South African students
6.
MULTIPLE CHOICE QUESTION
30 sec • 1 pt
What does a smaller mean suggest about the travel time of students in the United States?
They take longer to get to school
They have more varied travel times
They take less time to get to school
They have the same travel time as Australian students
7.
MULTIPLE CHOICE QUESTION
30 sec • 1 pt
What does a smaller MAD tell us about the data set?
The data points are closer together
The data points are more spread out
There are more outliers in the data
The data set has a higher mean
Access all questions and much more by creating a free account
Create resources
Host any resource
Get auto-graded reports
Continue with Google

Continue with Email
Continue with Classlink
Continue with Clever
or continue with
Microsoft
%20(1).png)
Apple
Others
Already have an account?
