Understanding Histograms and Box Plots
Interactive Video
•
Mathematics, Science, Biology
•
9th - 10th Grade
•
Practice Problem
•
Hard

Thomas White
FREE Resource
Read more
10 questions
Show all answers
1.
MULTIPLE CHOICE QUESTION
30 sec • 1 pt
What does a histogram primarily show about a data set?
The exact values of each data point
The frequency of data points within specific ranges
The average value of the data
The median of the data set
2.
MULTIPLE CHOICE QUESTION
30 sec • 1 pt
In a histogram, what does the height of a bar represent?
The total number of data points
The average value of the data points
The frequency of data points within that range
The range of data values
3.
MULTIPLE CHOICE QUESTION
30 sec • 1 pt
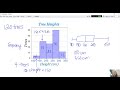
How many trees are in the first bin of the histogram?
Four
Thirty
Twenty-five
Fifty
4.
MULTIPLE CHOICE QUESTION
30 sec • 1 pt
What is the total number of trees measured in the histogram?
150
200
100
120
5.
MULTIPLE CHOICE QUESTION
30 sec • 1 pt
Which of the following is a key difference between histograms and box plots?
Box plots show the frequency of data points
Histograms can determine the median directly
Box plots provide the minimum and maximum values
Histograms show the exact values of data points
6.
MULTIPLE CHOICE QUESTION
30 sec • 1 pt
What can a box plot tell us that a histogram cannot?
The frequency of data points
The exact number of data points
The average value of the data
The minimum and maximum values
7.
MULTIPLE CHOICE QUESTION
30 sec • 1 pt
How is the median determined from a histogram?
By locating the bin where the middle data point falls
By identifying the middle value in the data set
By calculating the average of all data points
By finding the tallest bar
Access all questions and much more by creating a free account
Create resources
Host any resource
Get auto-graded reports
Continue with Google

Continue with Email
Continue with Classlink
Continue with Clever
or continue with
Microsoft
%20(1).png)
Apple
Others
Already have an account?
Popular Resources on Wayground

15 questions
Fractions on a Number Line
Quiz
•
3rd Grade
20 questions
Equivalent Fractions
Quiz
•
3rd Grade
25 questions
Multiplication Facts
Quiz
•
5th Grade
29 questions
Alg. 1 Section 5.1 Coordinate Plane
Quiz
•
9th Grade
22 questions
fractions
Quiz
•
3rd Grade
11 questions
FOREST Effective communication
Lesson
•
KG
20 questions
Main Idea and Details
Quiz
•
5th Grade
20 questions
Context Clues
Quiz
•
6th Grade
Discover more resources for Mathematics
29 questions
Alg. 1 Section 5.1 Coordinate Plane
Quiz
•
9th Grade
20 questions
Graphing Inequalities on a Number Line
Quiz
•
6th - 9th Grade
20 questions
Box and Whisker Plots
Quiz
•
9th Grade
18 questions
Exponential Growth and Decay
Quiz
•
9th Grade
20 questions
Function or Not a Function
Quiz
•
8th - 9th Grade
20 questions
SSS/SAS
Quiz
•
9th - 12th Grade
14 questions
Making Inferences From Samples
Quiz
•
7th - 12th Grade
23 questions
CCG - CH8 Polygon angles and area Review
Quiz
•
9th - 12th Grade